|
|
May 2026 San Francisco House & Condo Markets
Market Outlook
|
|
|
|
|
|
|
|
|
May 2026
Housing Market Report
|
|
Positive Momentum Meets Economic Crosswinds
|
|
As we roll into May 2026, the housing market has (finally) turned in some positive momentum and the economy in general is showing some positive reversals of recent trends. Equities markets have surged to new highs. The long-sluggish labor market has shown some green shoots of improvement. Unemployment and initial jobless claims remain relatively low and in the latest data, hiring and job creation seem to have improved.
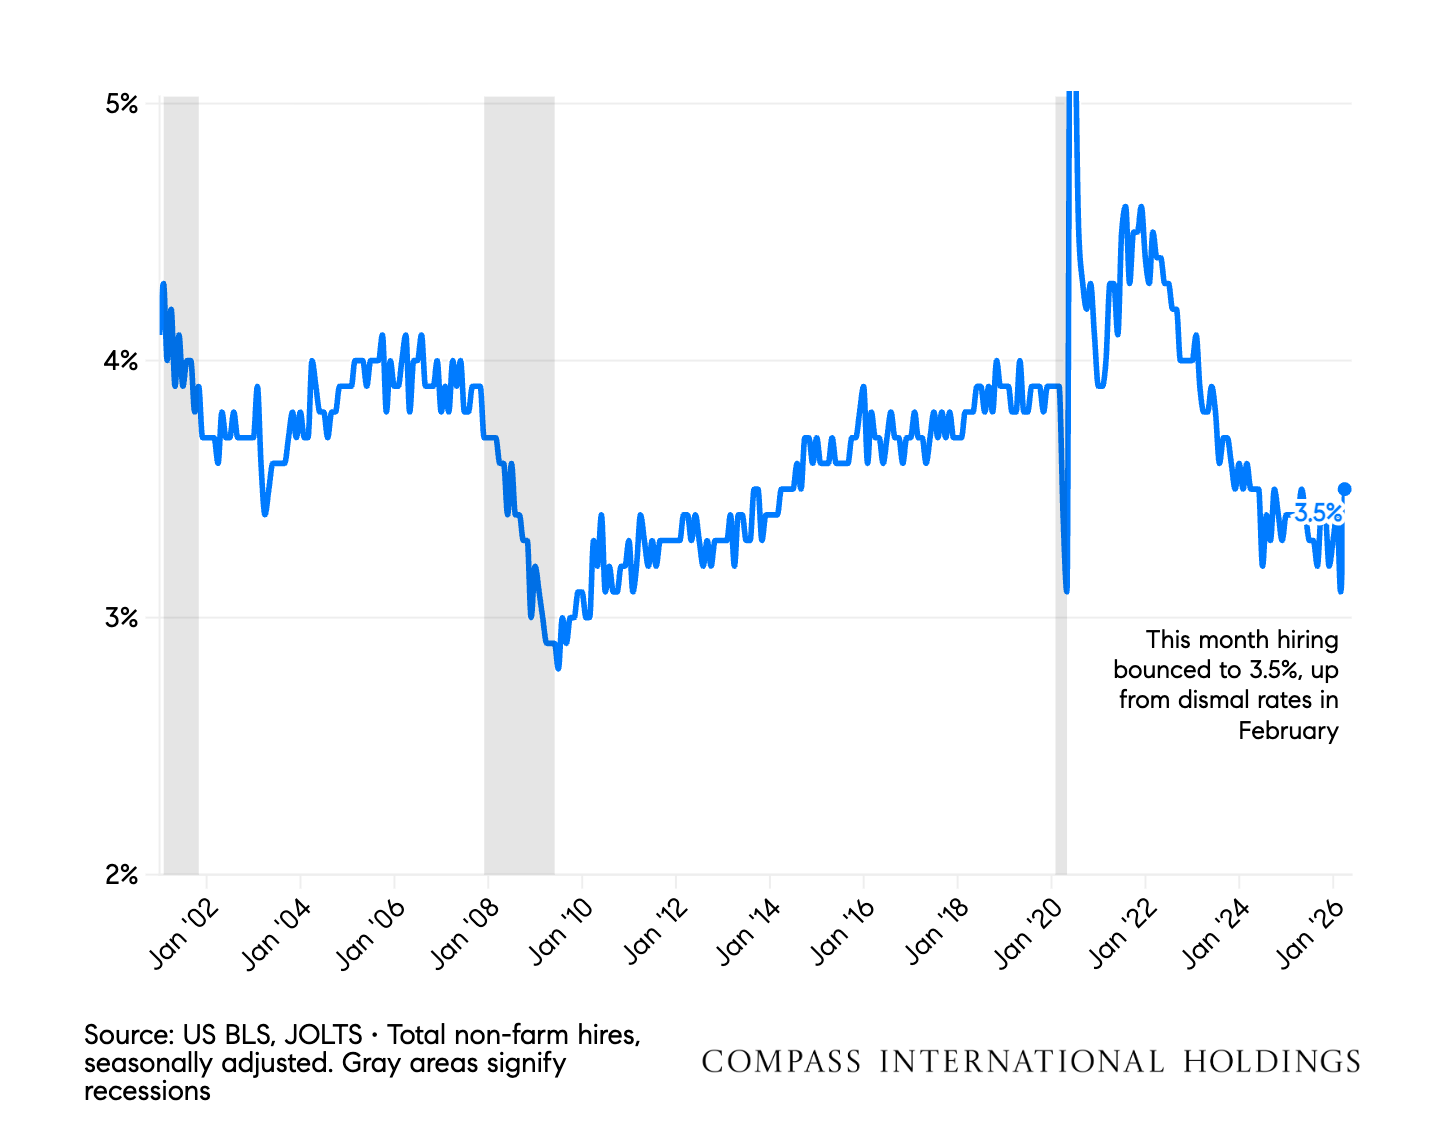
In this year’s housing cycle, we’re focused more on the hiring rate in the economy rather than the usual unemployment numbers. Since relocation-for-work is one of the big drivers of housing demand, a very low hiring rate in 2026 continues to be the biggest drag on housing demand after affordability. If companies are not hiring quickly, there are fewer people moving for work.
In March, the hiring rate data was as low now as the bottom or the pandemic shutdown. But in April the data rebounded to 3.5%. Continued growth in hiring will be important if home sales are going to grow meaningfully for the rest of 2026.
The negative news in this spring’s economy is around inflation. Energy costs, tariffs, and government spending are all contributing to rising prices. The war-driven uncertainty has driven energy prices sharply higher and the Inflation impacts are only just hitting the economy now.
Unfortunately, higher inflation and stronger employment is not the economic setup that tends to push interest rates lower. So don’t look to the Fed for interest rate relief any time soon.
An interesting question is whether a booming stock market is enough to move the needle on the housing market. We can see the AI boom directly in San Francisco home prices and rents, but it remains to be seen whether middle America feels a wealth boom from equities or a cash crunch from inflation, and how that impacts home buying activity through the summer.
I was in Austin last week for a Compass event. That market may be on the cusp of a turnaround, finally. After four relentless years with inventory climbing, the supply of homes on the market in Austin (Dallas too) is now below last year and ticking downward. Anyone in the Austin market knows that there have been home price pressures for several years, is this finally the inflection point? Stay tuned.
Mike Simonsen
Chief Economist
Compass International Holdings
|
|
|
|
|
|
|
|
|
Low Hiring Rates Keep Us From Moving
|
|
March 2026 showed an encouraging uptick in the hiring data
|
|
|
|
|
|
|
|
|
March 2026 hiring rates settled at 3.5%, reflecting a return to stability after pandemic-era volatility that peaked at 4.4% in March 2022. The labor market has normalized from those elevated recovery levels, with hiring rates consistently declining from 3.8% in March 2023 to the current 3.5%, signaling equilibrium after years of disruption.
|
|
|
|
|
|
|
|
|
Unemployment Signals Remain Very Low
|
|
Unemployment can drive the housing cycle. Low unemployment now implies very little distressed inventory through 2027
|
|
|
|
|
|
|
|
|
April initial jobless claims declined steadily from 370,000-390,000 in 2012 to historic lows of 196,000-224,000 by April 2019, reflecting the tightest labor market in generations. Recent April readings have stabilized in the 200,000-240,000 range from 2022 through 2025, with April 2026 printing 190,000 on April 25, matching the pre-2020 lows and signaling sustained labor market tightness.
|
|
|
|
|
|
|
|
|
|
|
Market shows signs of improving from a very weak 2025
|
|
|
|
|
|
|
|
|
April job gains have deteriorated from solid monthly averages around 200,000 in 2023 to increasingly volatile and weaker performance in subsequent years. April 2026 added 115,000 jobs, well below the consistent gains seen in 2023 and reflecting the broader pattern of labor market weakening that has characterized 2025-2026 with multiple months of outright job losses.
|
|
|
|
|
|
|
|
|
Inflation is High and Pushing Higher
|
|
Tariffs, oil, and government spending are all contributing to re-accelerating inflation
|
|
|
|
|
|
|
|
|
Inflation surged from under 1% in 2020 to peak at 9.0% CPI and 7.2% PCE in June 2022, then declined steadily through 2023-2024 to approach the Fed's 2% target before stalling in 2025. The latest March 2026 print showed CPI at 3.3% and PCE at 3.5%, the highest readings since early 2024 and a clear reacceleration that threatens the Fed's rate cut timeline.
|
|
|
|
|
|
|
|
|
Oil Prices Hit 4-year High In April
|
|
Oil prices drive inflation fears which push interest rates higher
|
|
|
|
|
|
|
|
|
Oil prices in April reflected the broader volatility of 2016-2019, trading in the $40s during April 2016 as markets recovered from the prior crash, climbing to the $60s by April 2018 amid OPEC production cuts and tightening supply, then moderating back to the mid-$60s in April 2019 after the dramatic Q4 2018 collapse. The April-to-April progression from the $40s to $60s demonstrated how sensitive energy markets had become to marginal supply shifts from shale producers and OPEC policy changes.
|
|
|
|
|
|
|
|
|
|
|
Periods when the market rate is above the outstanding rate, lock-in slows home sales.
|
|
|
|
|
|
|
|
|
Two housing metrics in April's quarter tell completely different stories about the post-financial crisis cycle. The outstanding rate declined steadily from 5.3% in Q2 2013 to 4.0% by Q2 2021 before reversing sharply to 4.5% by Q2 2026, while the market rate fluctuated between 3.6-4.5% from 2013-2019, collapsed to 3.0% in Q2 2021, then surged to 7.0% by Q2 2024 before easing to 6.1% in Q2 2026, still double the COVID-era lows and reflecting persistently restrictive affordability conditions.
|
|
|
|
|
|
|
|
|
Very Few Foreclosures in 2026
|
|
Due to high equity, low locked-in mortgage rates, and low unemployment, foreclosures are likely to stay low for 2026
|
|
|
|
|
|
|
|
|
Q2 foreclosures peaked at 566,000 in 2009 during the housing crisis, then normalized to the 70,000-85,000 range by 2017-2019 before COVID forbearance programs collapsed them to an all-time low of 8,100 in Q2 2021. Q2 2025 recorded 52,800 foreclosures, up from 47,180 in Q2 2024 and more than six times the COVID-era low, signaling building distress among borrowers who purchased at peak prices and now face affordability pressures without refinancing options.
|
|
|
|
|
|
|
|
|
|
|
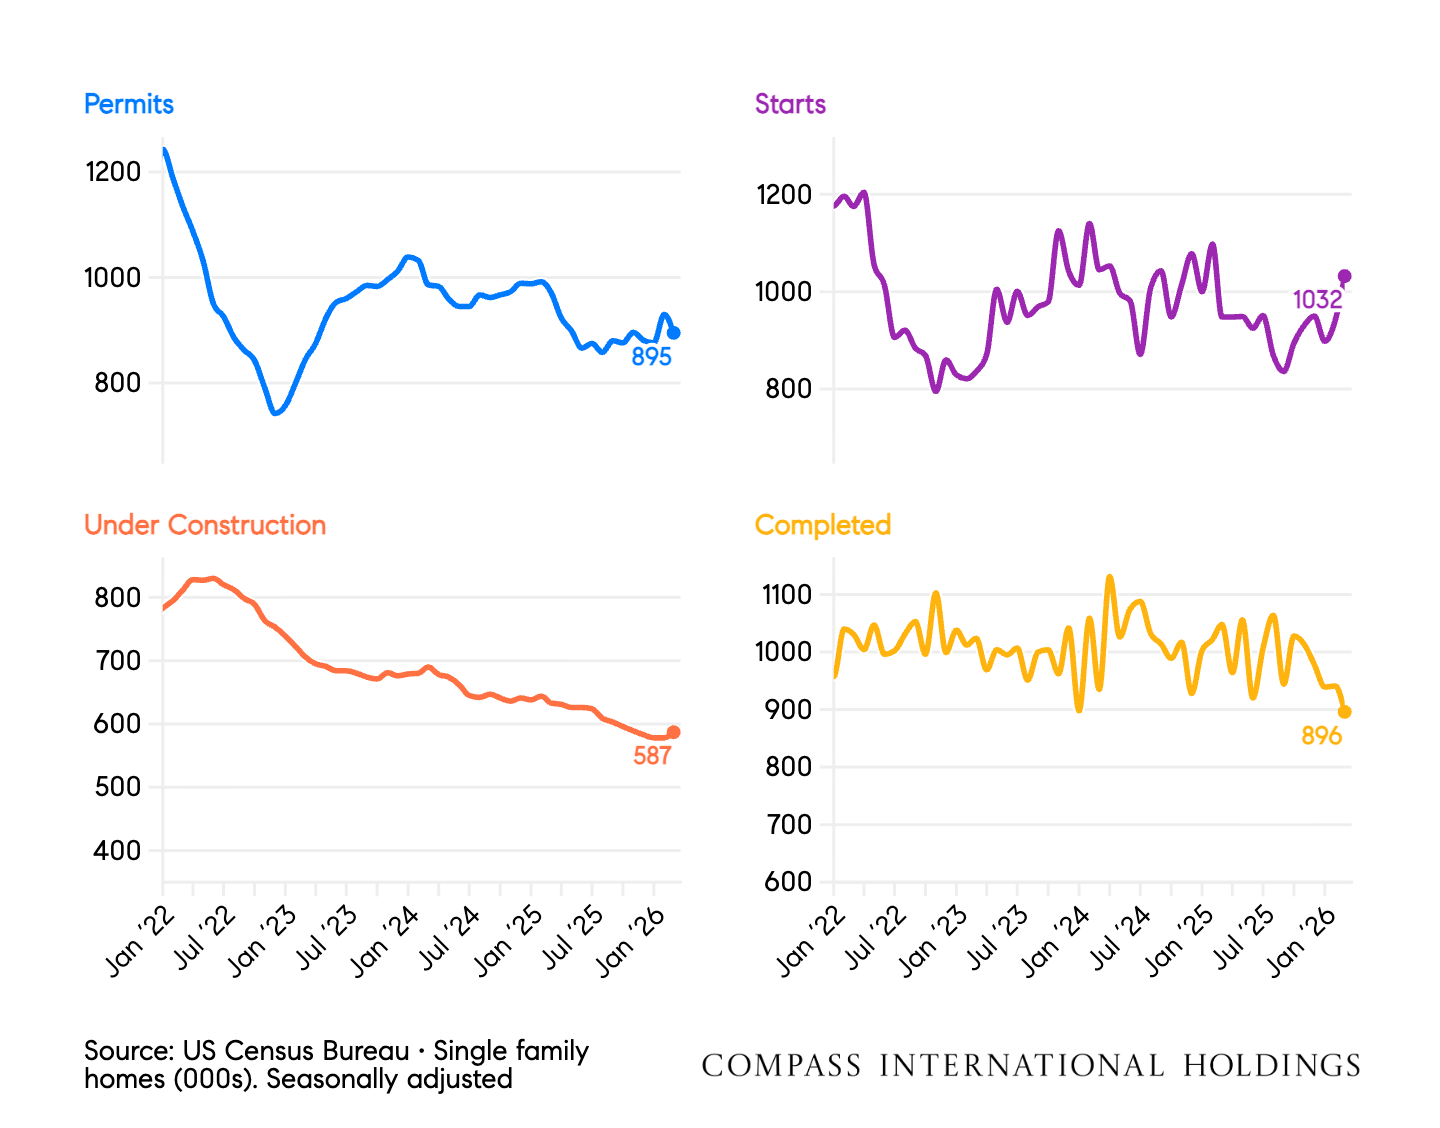
Permits, starts, and construction in progress are all in multi-year declines.
|
|
|
|
|
|
|
|
|
April homebuilding data shows the sector's dramatic arc from collapse to boom to deflation: permits crashed to 665k in April 2020, surged to 1,128k in April 2021, then peaked at 1,087k in April 2022 before declining to 923k by April 2025 as affordability deteriorated. The critical metric is under construction, which peaked at 828k in April 2022 and has collapsed 24% to just 631k by April 2025, the lowest April reading in five years and a signal that the completion boom sustaining new home inventory is ending fast.
|
|
|
|
|
|
|
San Francisco House Prices
|
|
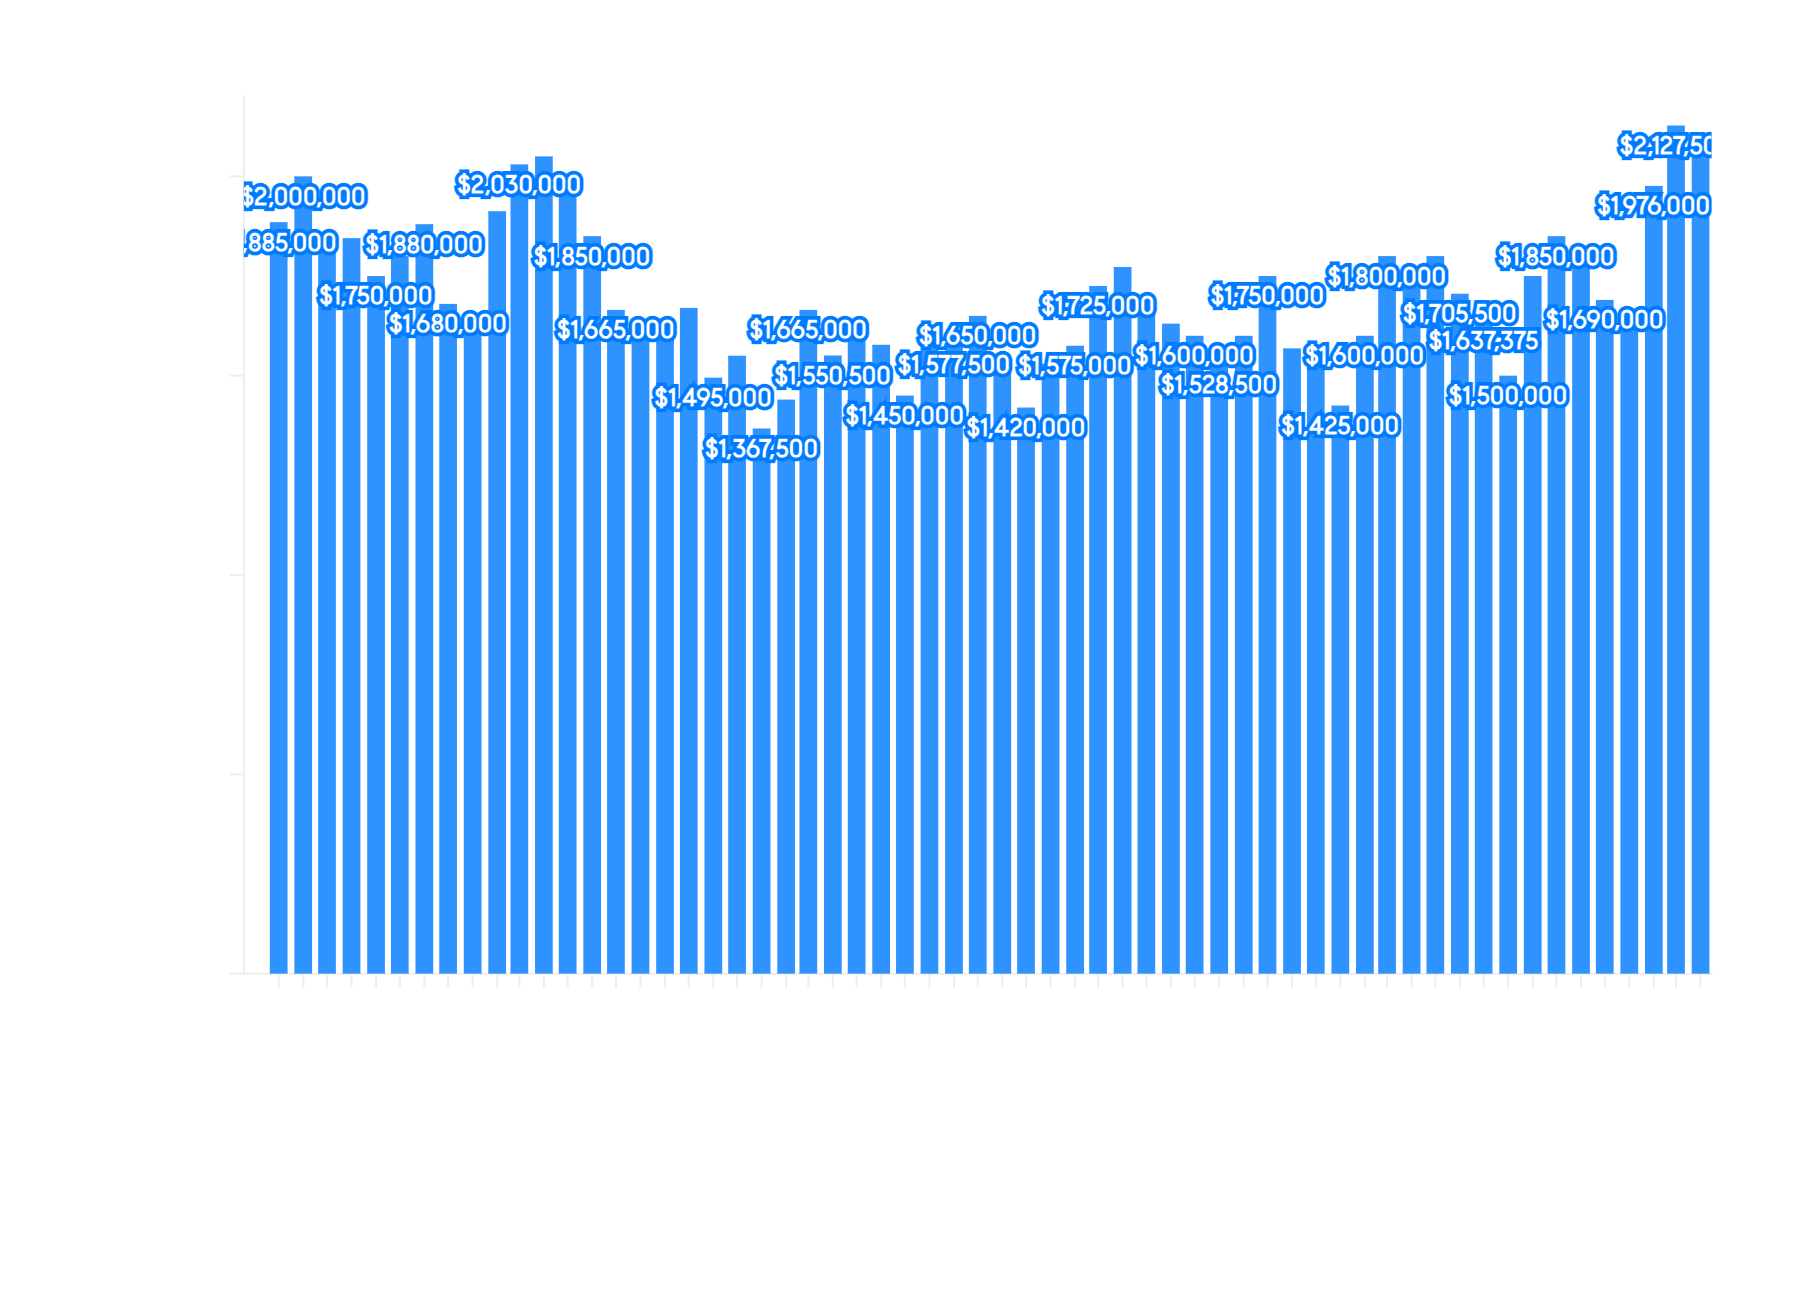
Historical County Median Sale Price Trends
|
|
|
|
|
|
|
|
|
Many factors affect home values: architectural style, quality of construction, square footage, condition, amenities, light, views, privacy, outdoor space, “bonus” rooms, additional parking, quality of location within the neighborhood, and so on.
|
|
|
|
|
|
|
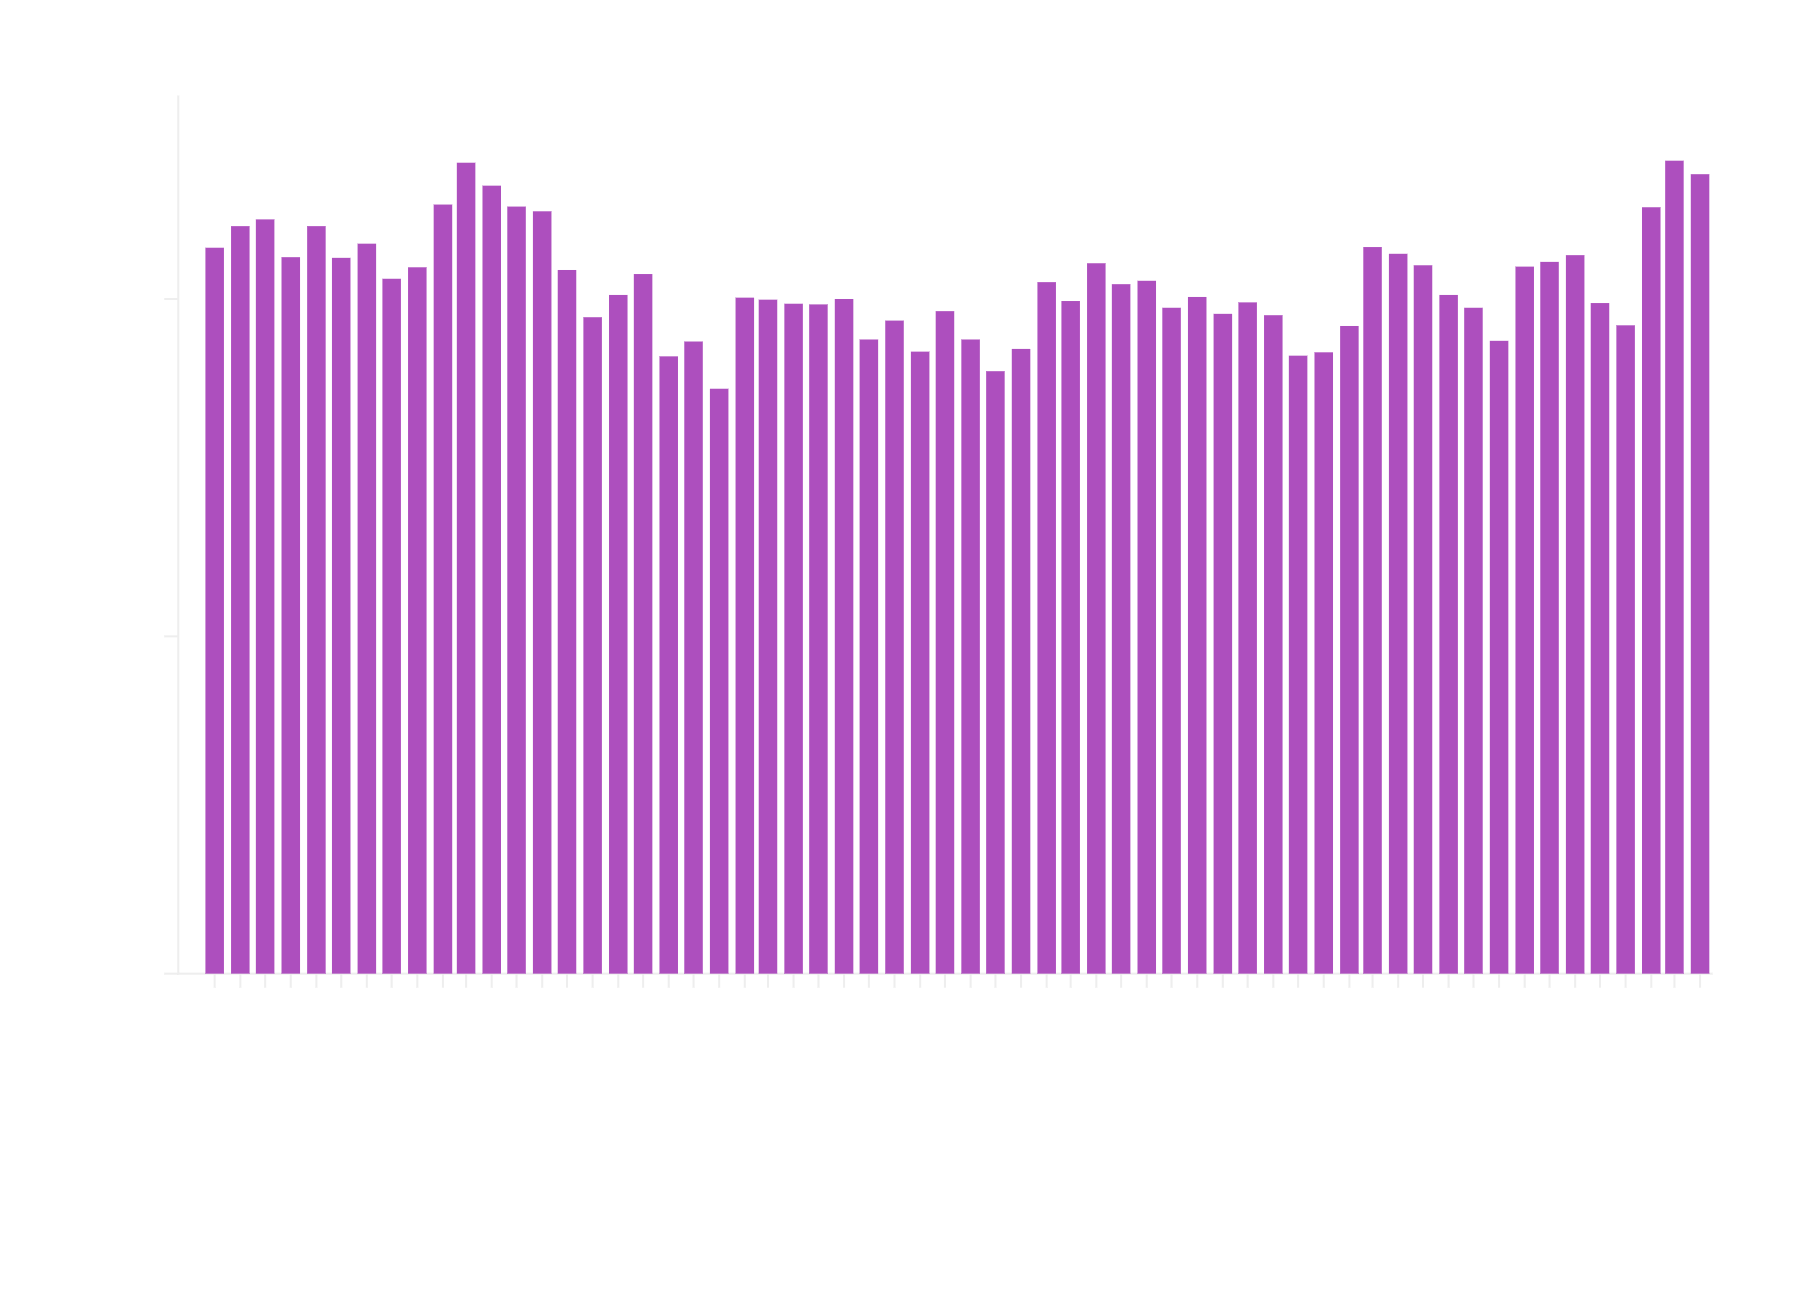
San Francisco Median PPSF
|
|
Historical County Median Sale Price Trends
|
|
|
|
|
|
|
|
|
The calculation of dollar per square foot is based on interior living space and doesn’t include garages, attics, basements, rooms built without permit, decks, patios or lot size (though all these can add value to the home).
|
|
|
|
|
|
|
|
|
Historical County Sale Trends
|
|
|
|
|
|
|
|
|
Closed sale trends reflect the number of completed real estate transactions over the past five years and provide insight into market activity, buyer demand, and overall housing market health across different time periods and seasonal patterns.
|
|
|
|
|
|
|
San Francisco New Listings
|
|
Historical County New Listing Trends
|
|
|
|
|
|
|
|
|
New listing trends reflect the number of properties entering the market over the past five years and provide insight into seller activity, inventory levels, and overall housing supply across different time periods and seasonal patterns.
|
|
|
|
|
|
|
|
|
Historical County Active Listing Trends
|
|
|
|
|
|
|
|
|
Active inventory trends reflect the number of properties available for sale at any given time over the past five years and provide insight into market supply, competitive conditions, and the balance between buyers and sellers across different time periods and seasonal patterns.
|
|
|
|
|
|
|
|
|
Historical County Days on Market Trends
|
|
|
|
|
|
|
|
|
Days on market trends reflect the median time properties remain listed before selling over the past five years and provide insight into market pace, buyer urgency, and whether conditions favor buyers or sellers across different time periods and seasonal patterns.
|
|
|
|
|
|
|
|
|
Historical County Sale to List Percentage Market Trends
|
|
|
|
|
|
|
|
|
Sold to list percentage trends reflect the ratio between final sale prices and original asking prices over the past five years and provide insight into market competitiveness, pricing accuracy, and whether conditions favor buyers or sellers across different time periods and seasonal patterns.
|
|
|
|
|
|
|
San Francisco House Prices
|
|
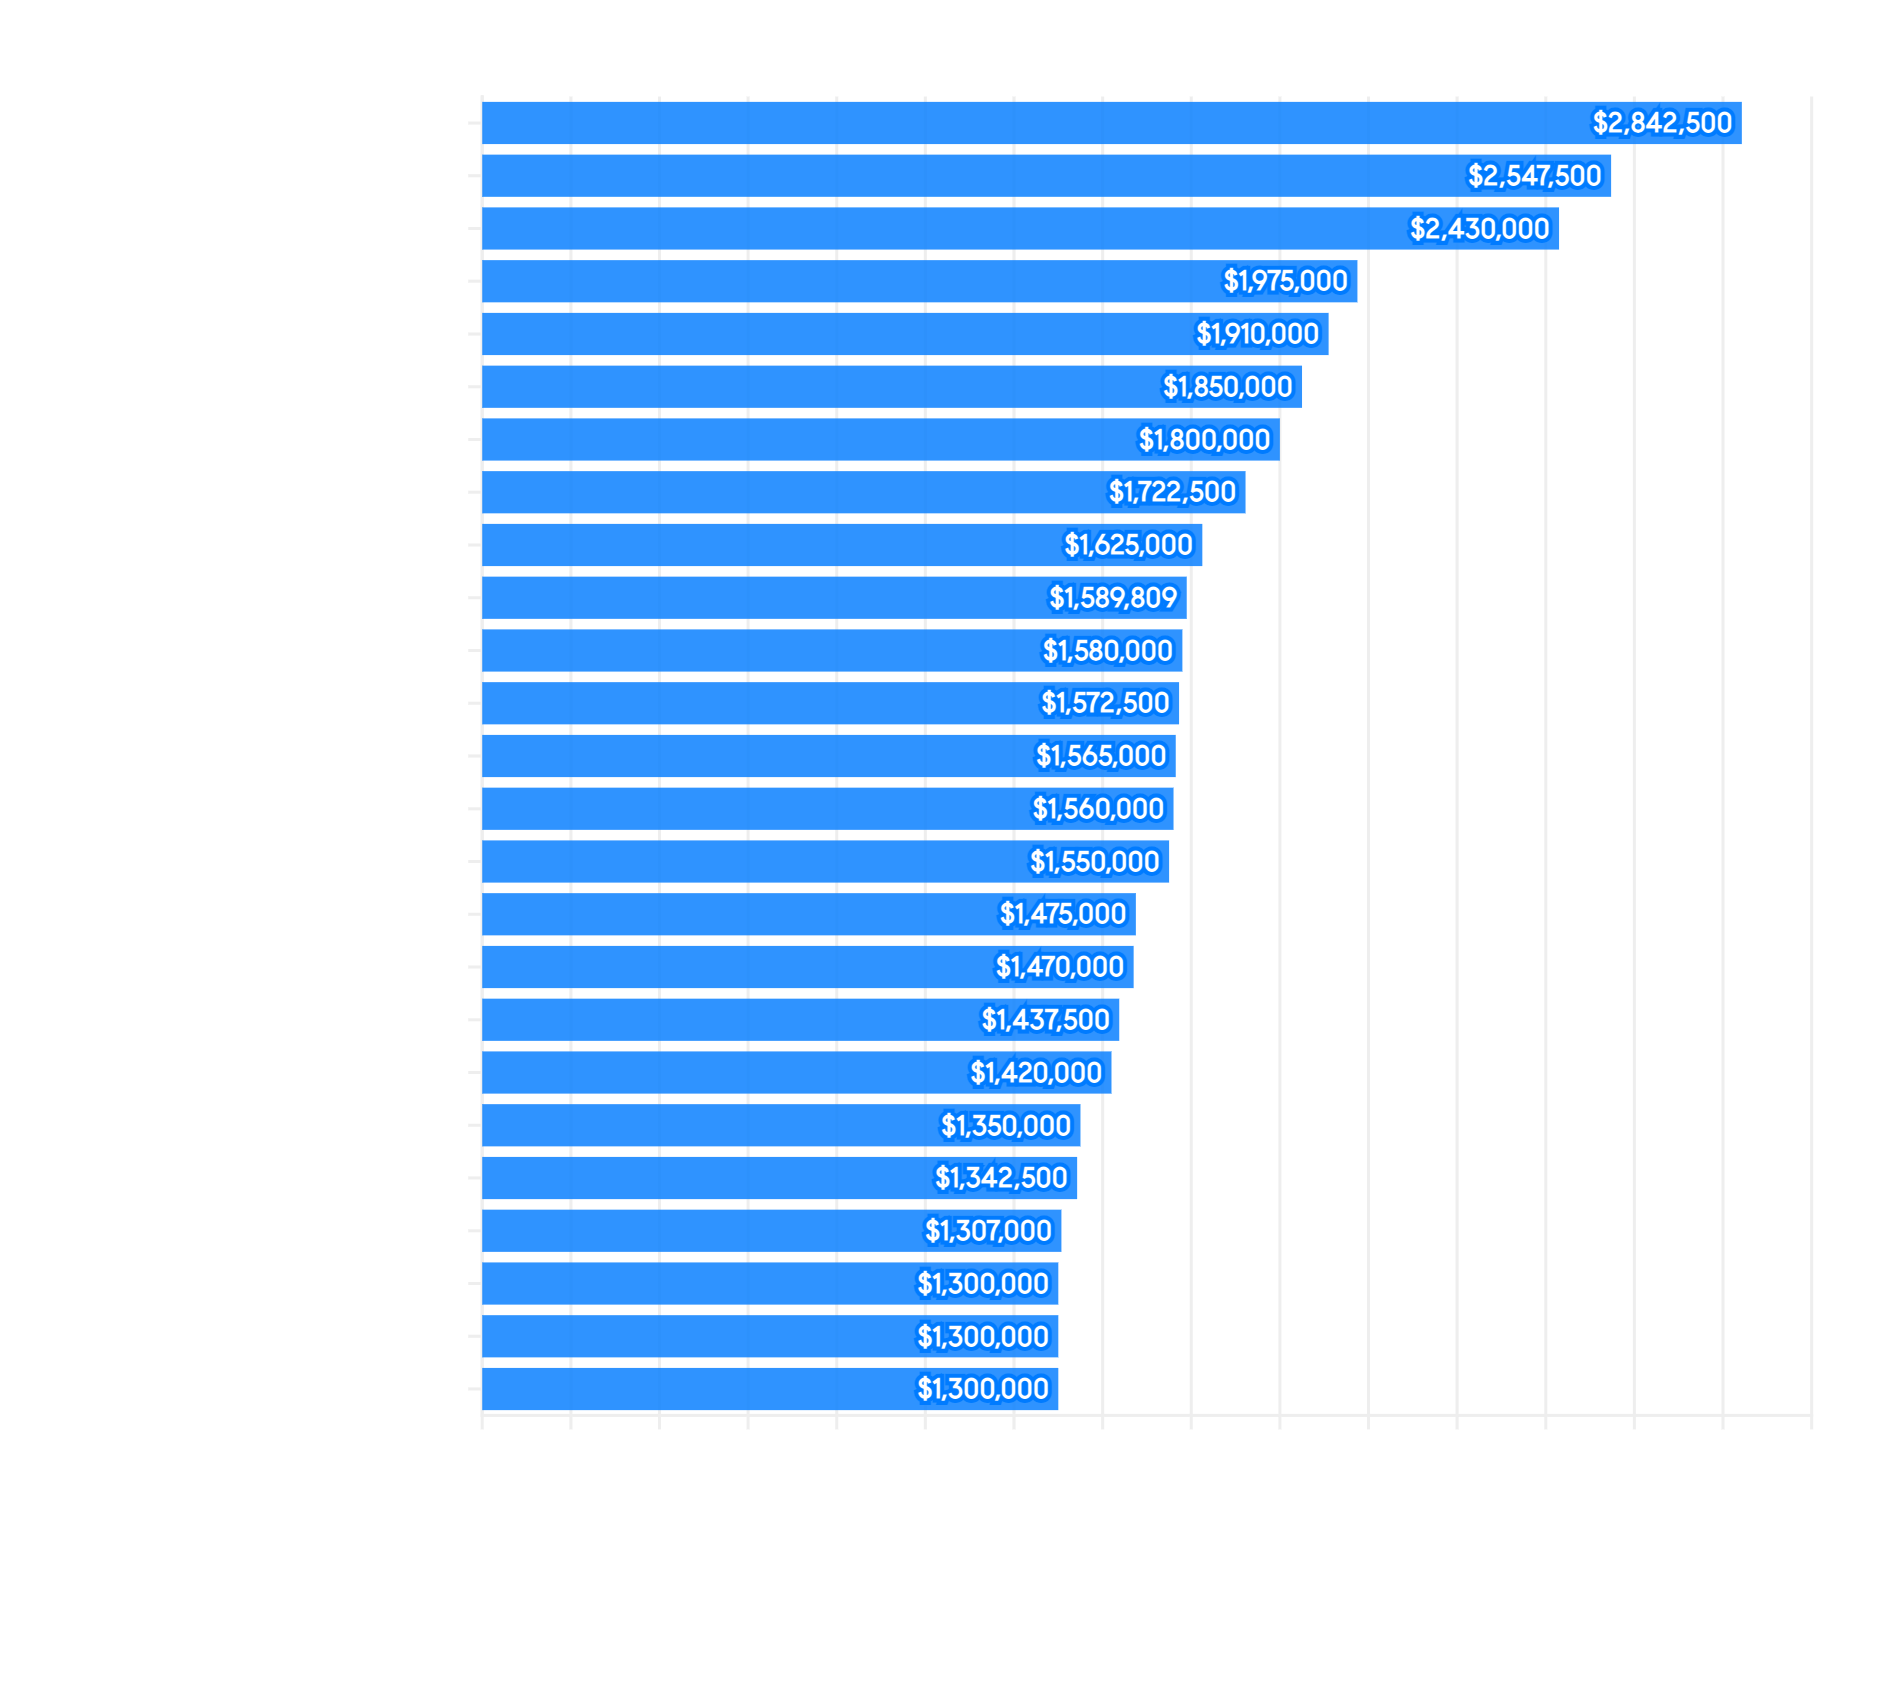
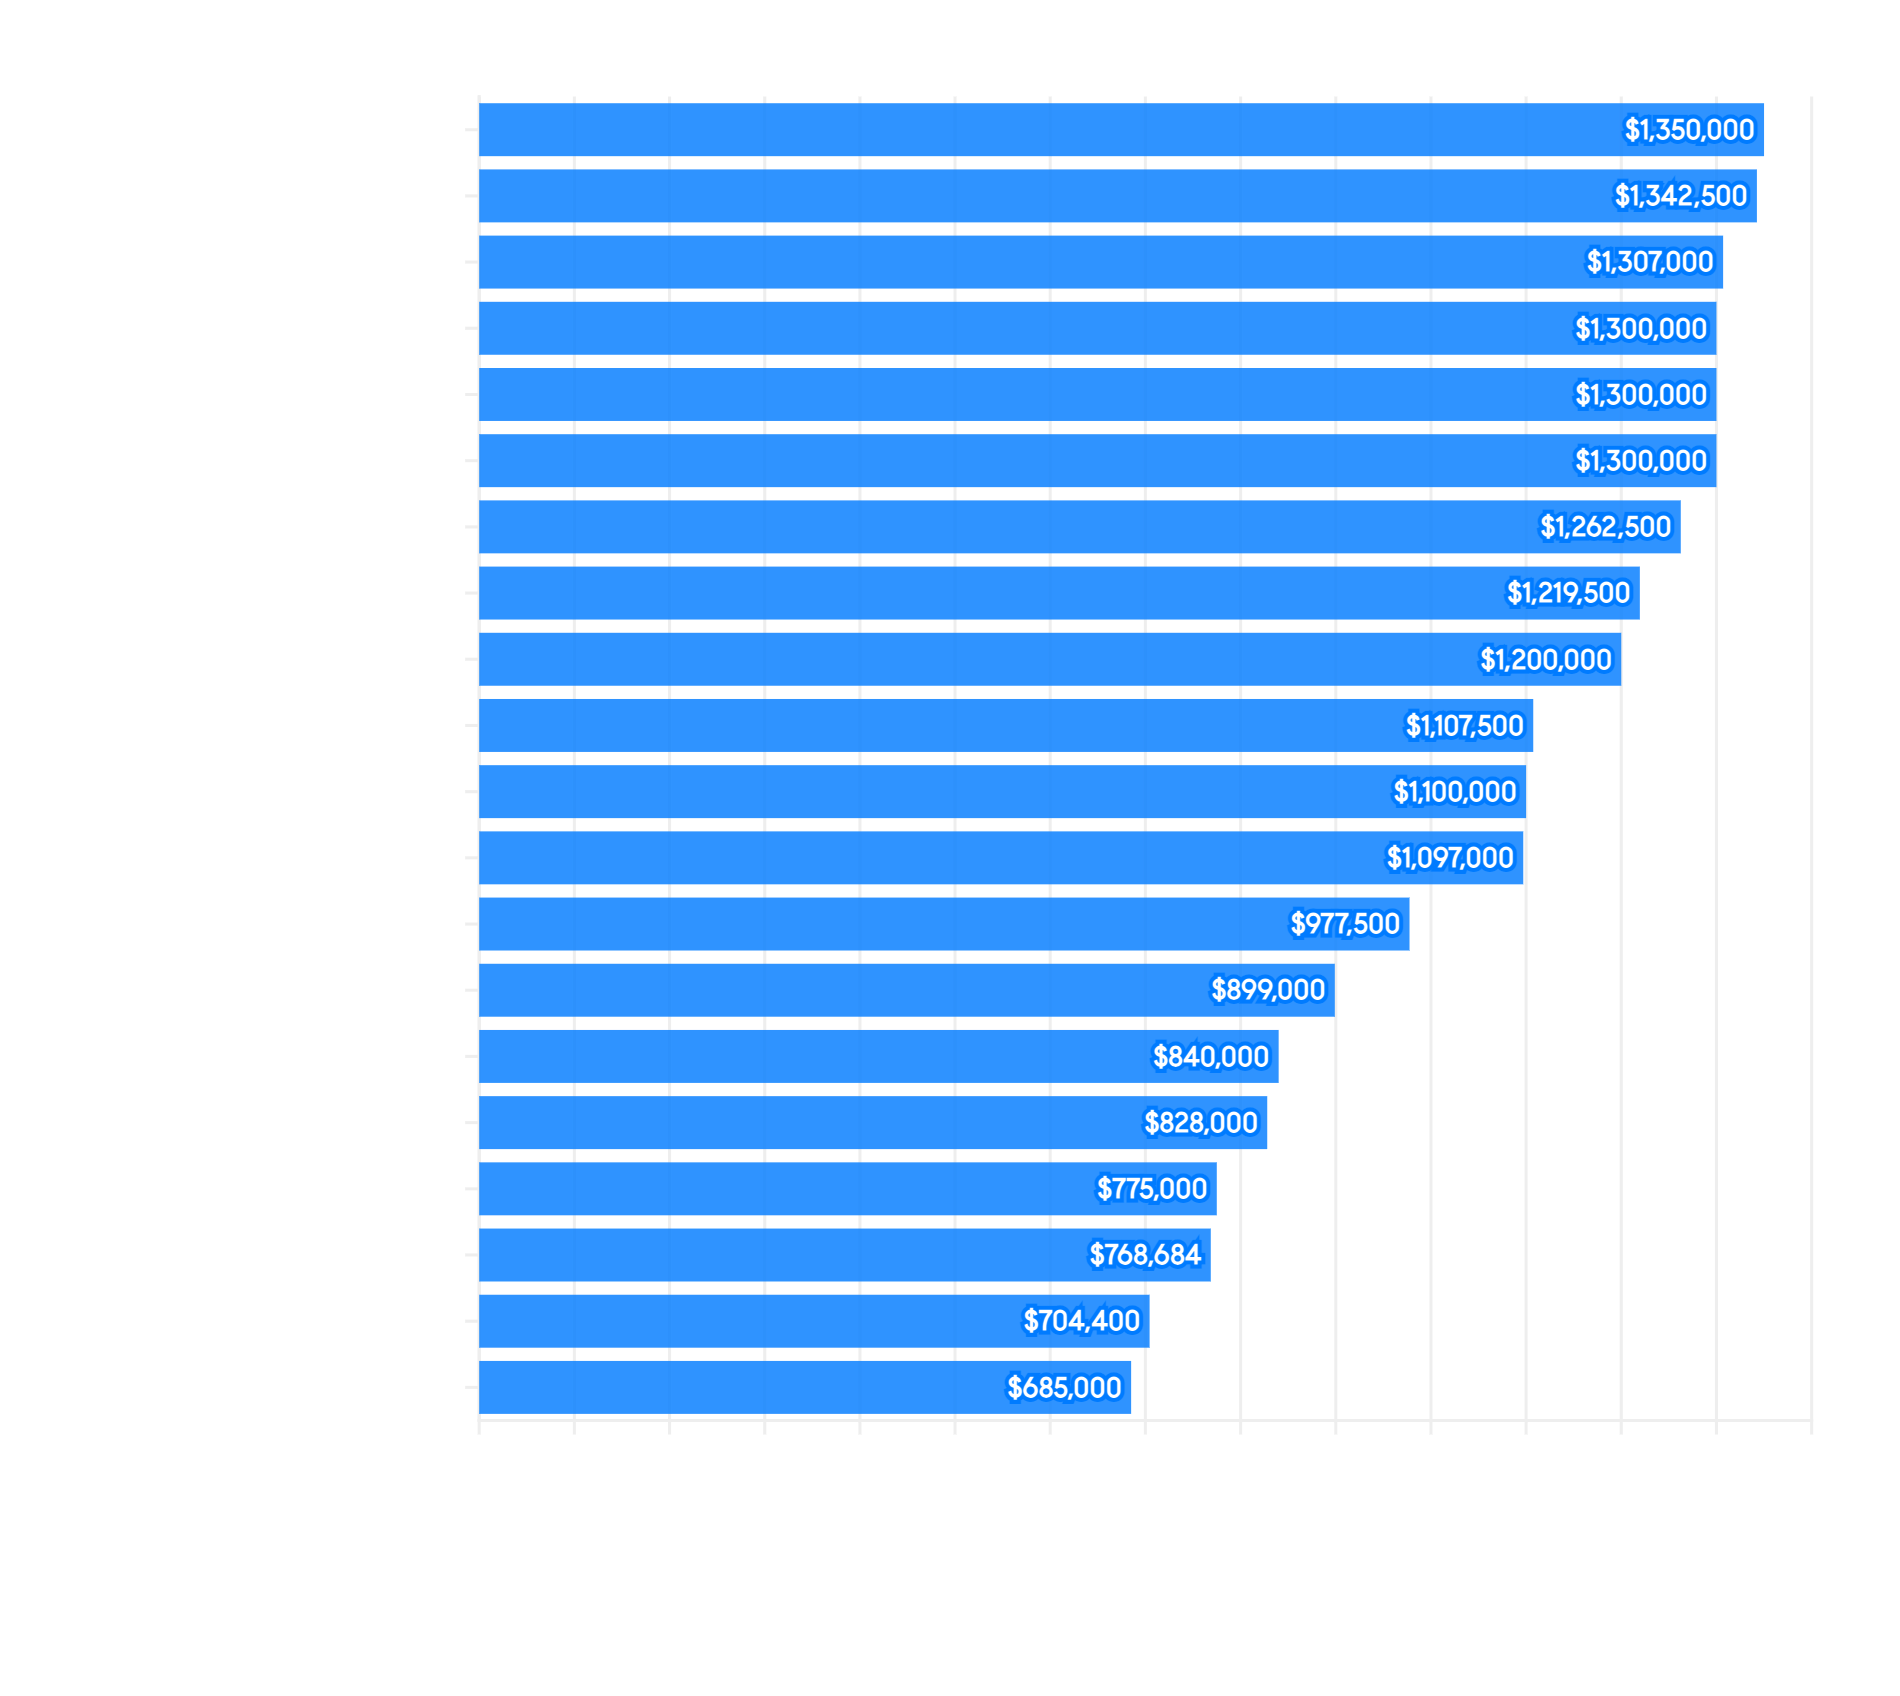
April Median HOUSE Sales Prices
Selected Neighborhoods
|
|
|
|
|
|
|
|
|
Many factors affect home values: architectural style, quality of construction, square footage, condition, amenities, light, views, privacy, outdoor space, “bonus” rooms, additional parking, quality of location within the neighborhood, and so on.
|
|
|
|
|
|
|
San Francisco Median PPSF
|
|
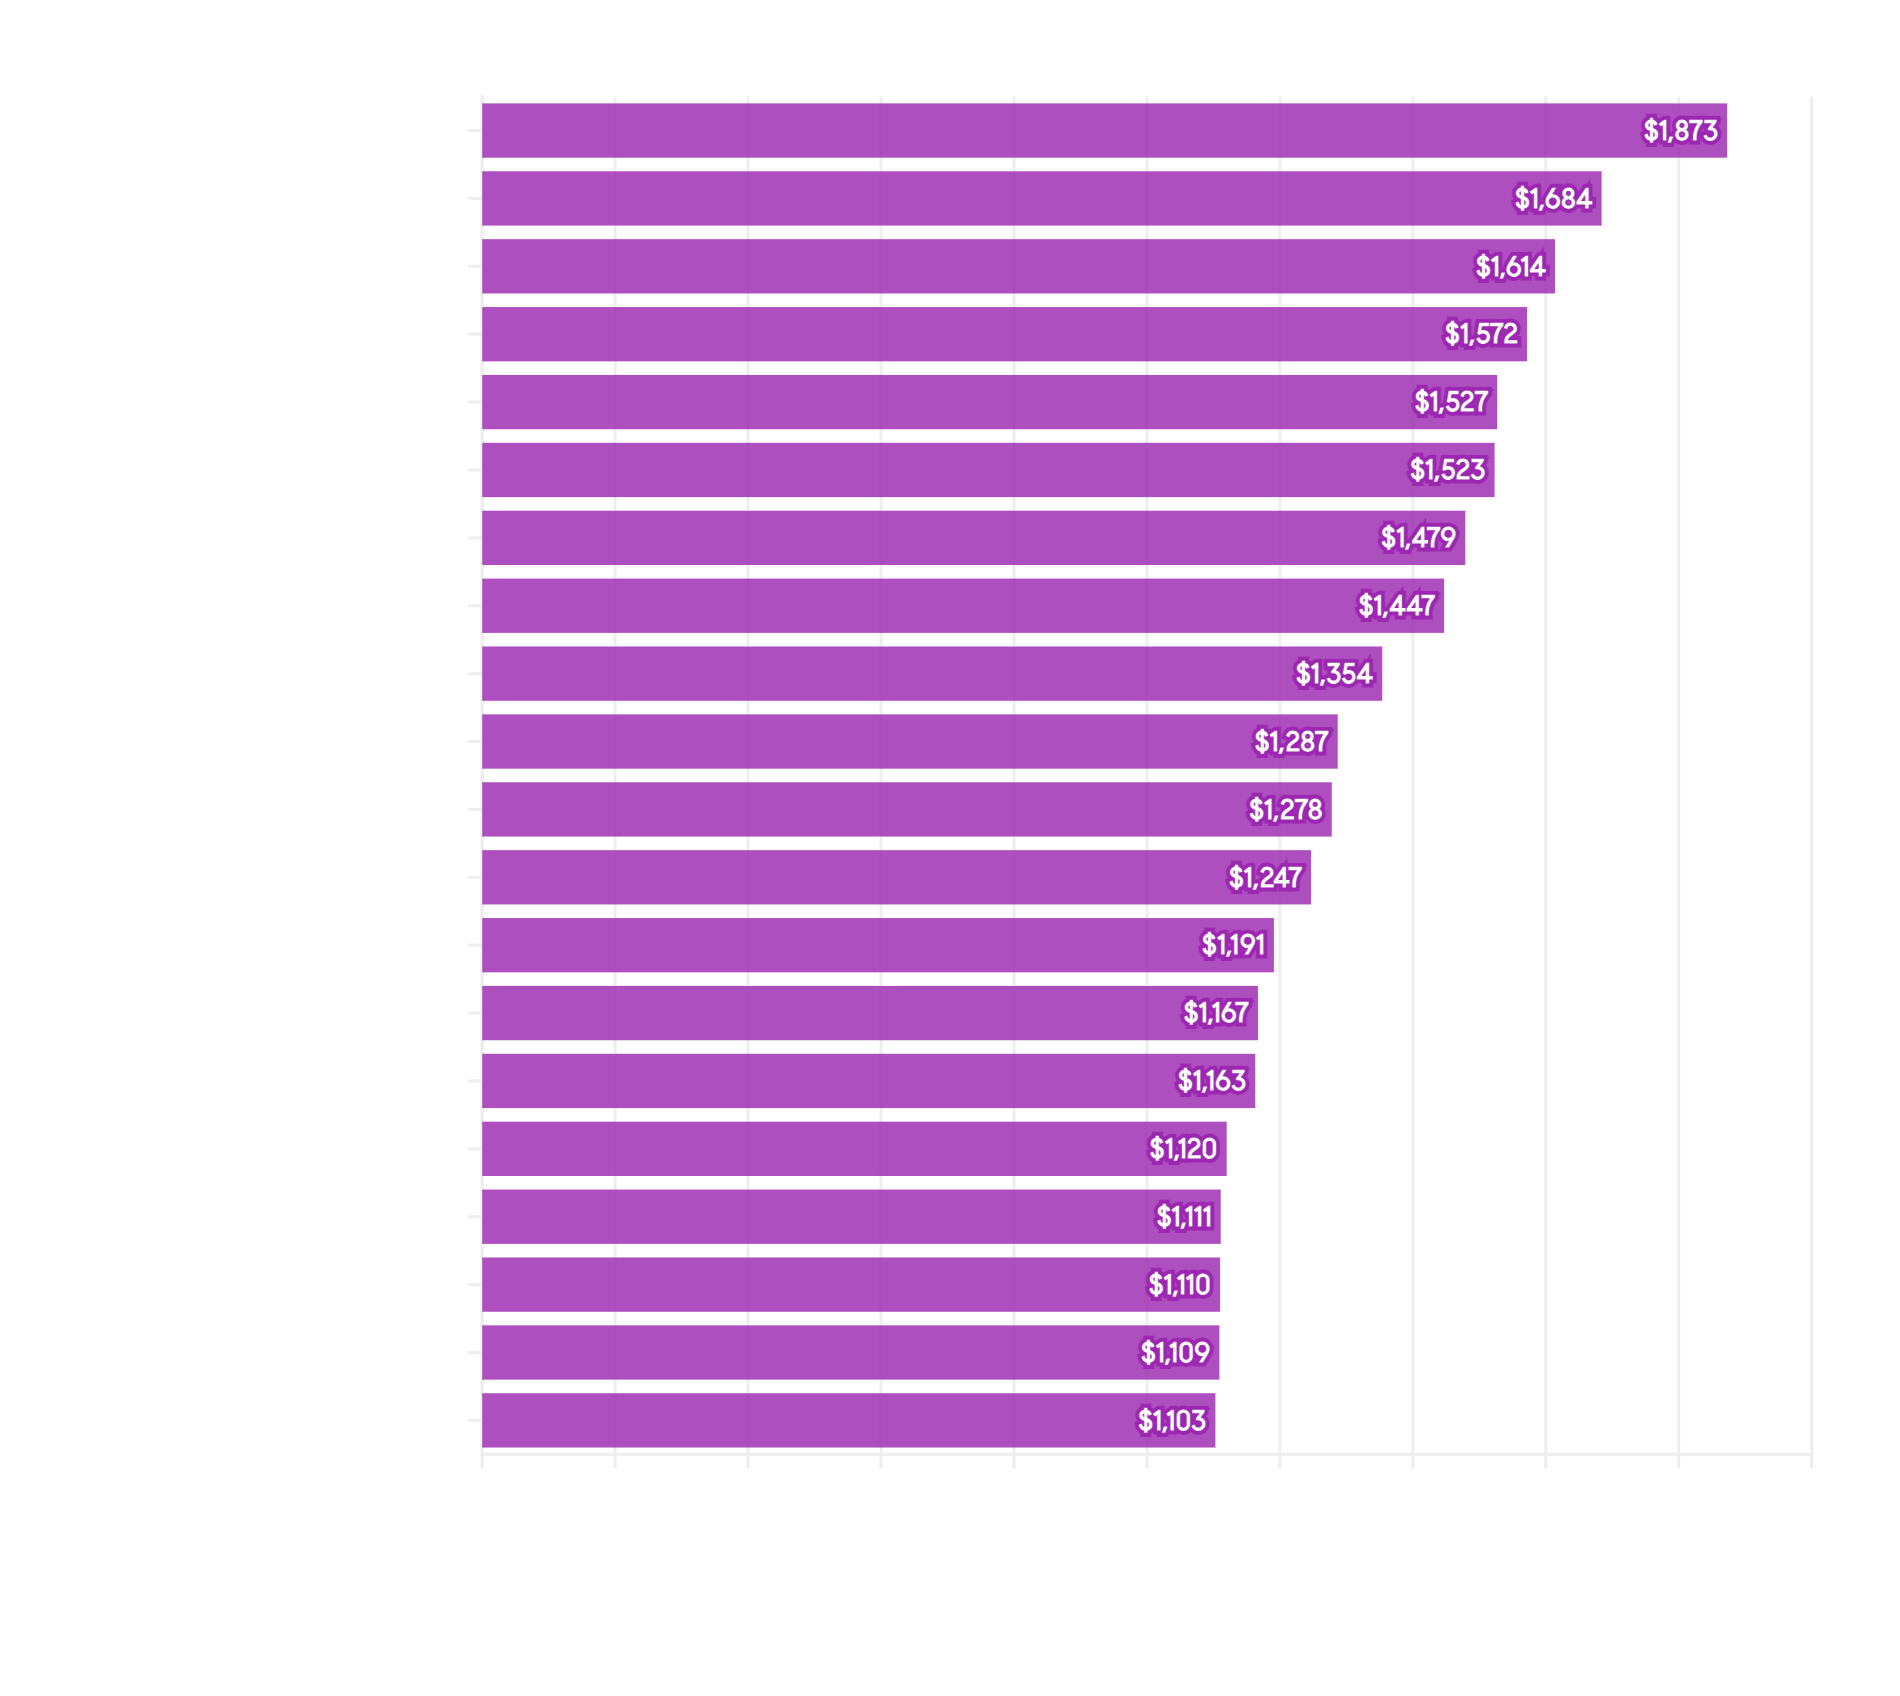
April Median HOUSE $/Sq.Ft. Values
Selected Neighborhoods
|
|
|
|
|
|
|
|
|
The calculation of dollar per square foot is based on interior living space and doesn’t include garages, attics, basements, rooms built without permit, decks, patios or lot size (though all these can add value to the home).
|
|
|
|
|
|
|
San Francisco Median SQFT
|
|
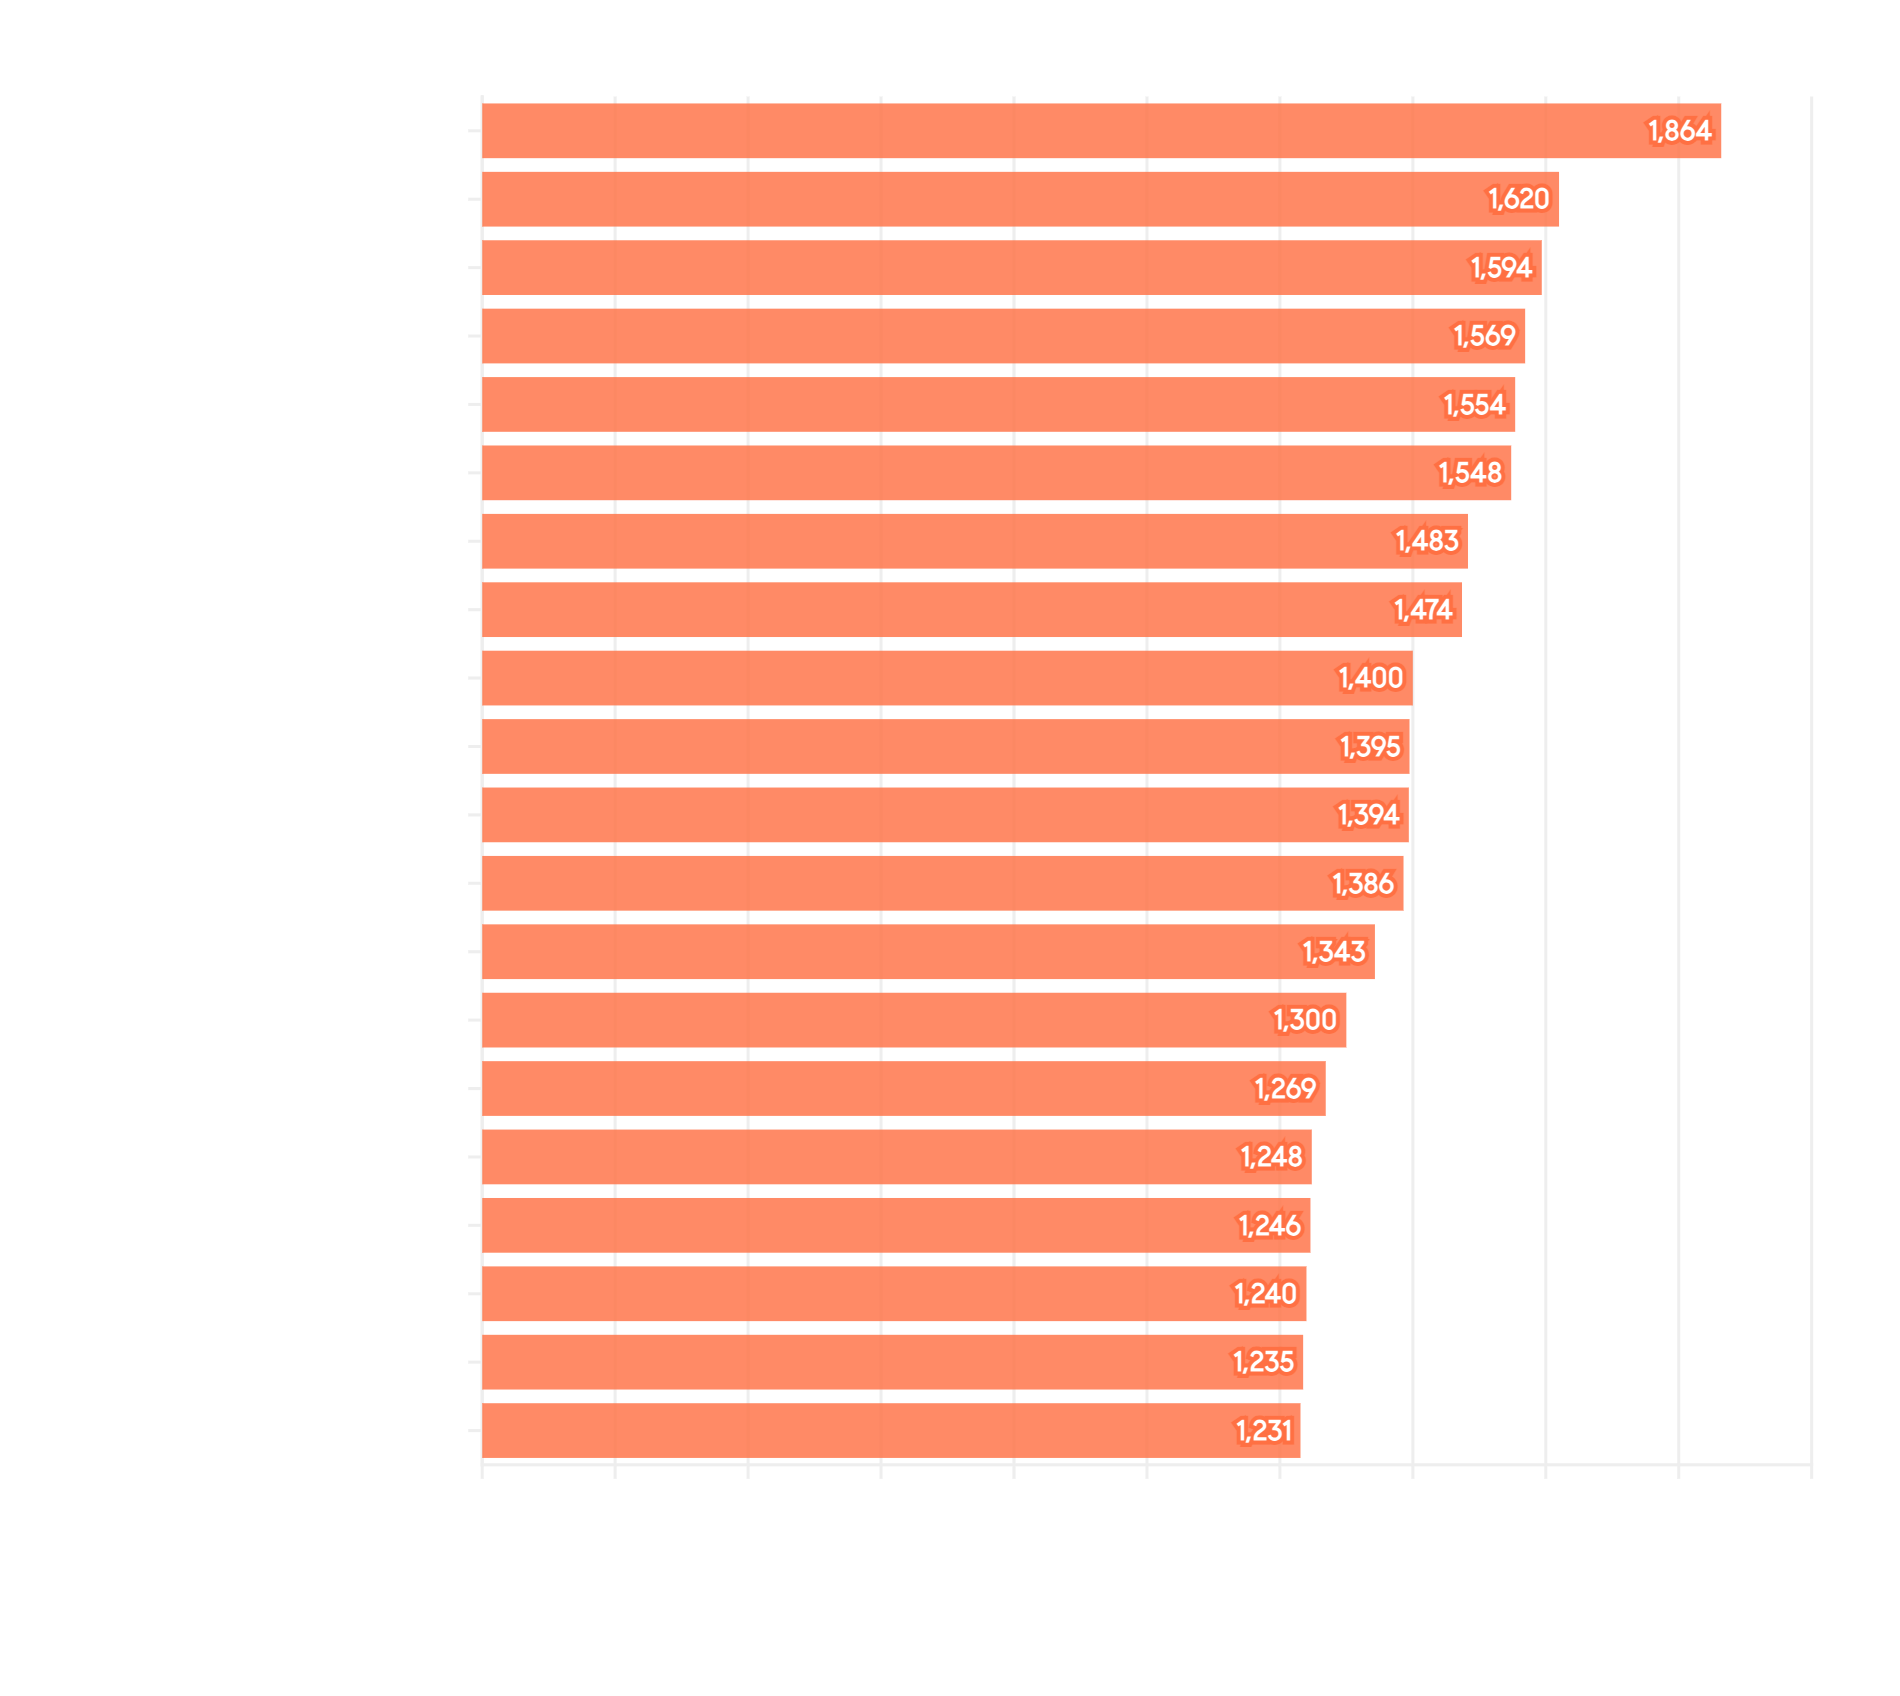
April Median HOUSE Square Footage
Selected Neighborhoods
|
|
|
|
|
|
|
|
|
Many factors affect home values: architectural style, quality of construction, square footage, condition, amenities, light, views, privacy, outdoor space, “bonus” rooms, additional parking, quality of location within the neighborhood, and so on.
|
|
|
|
|
|
|
San Francisco Neighborhoods with Most House Sales
|
|
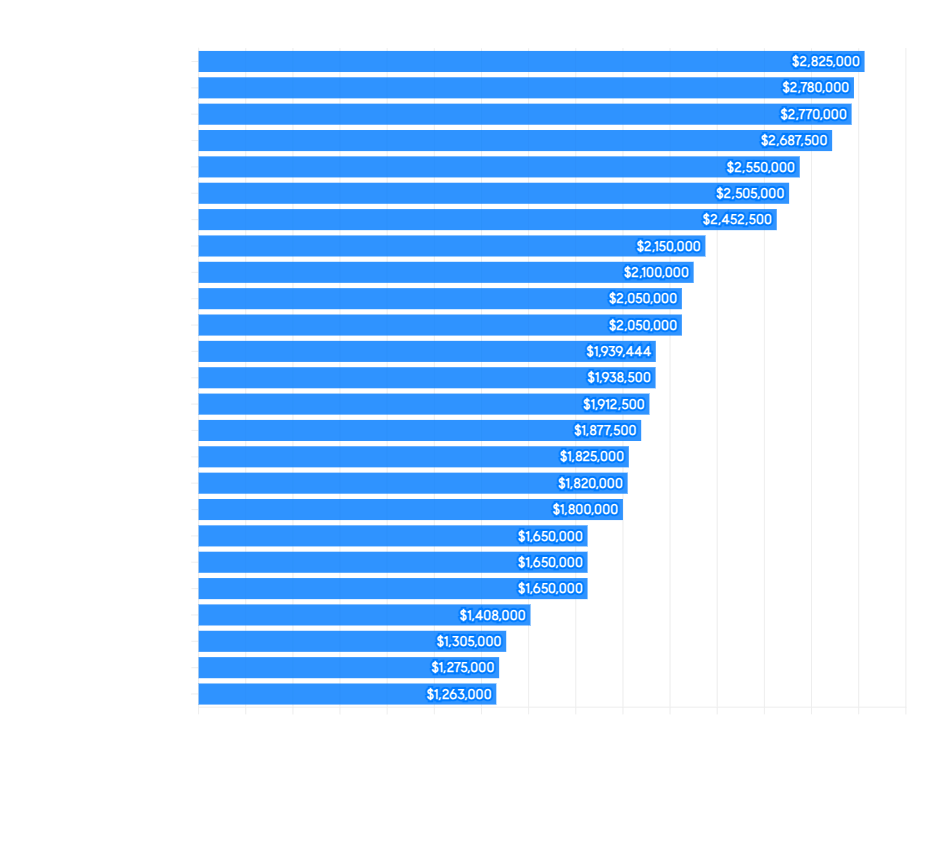
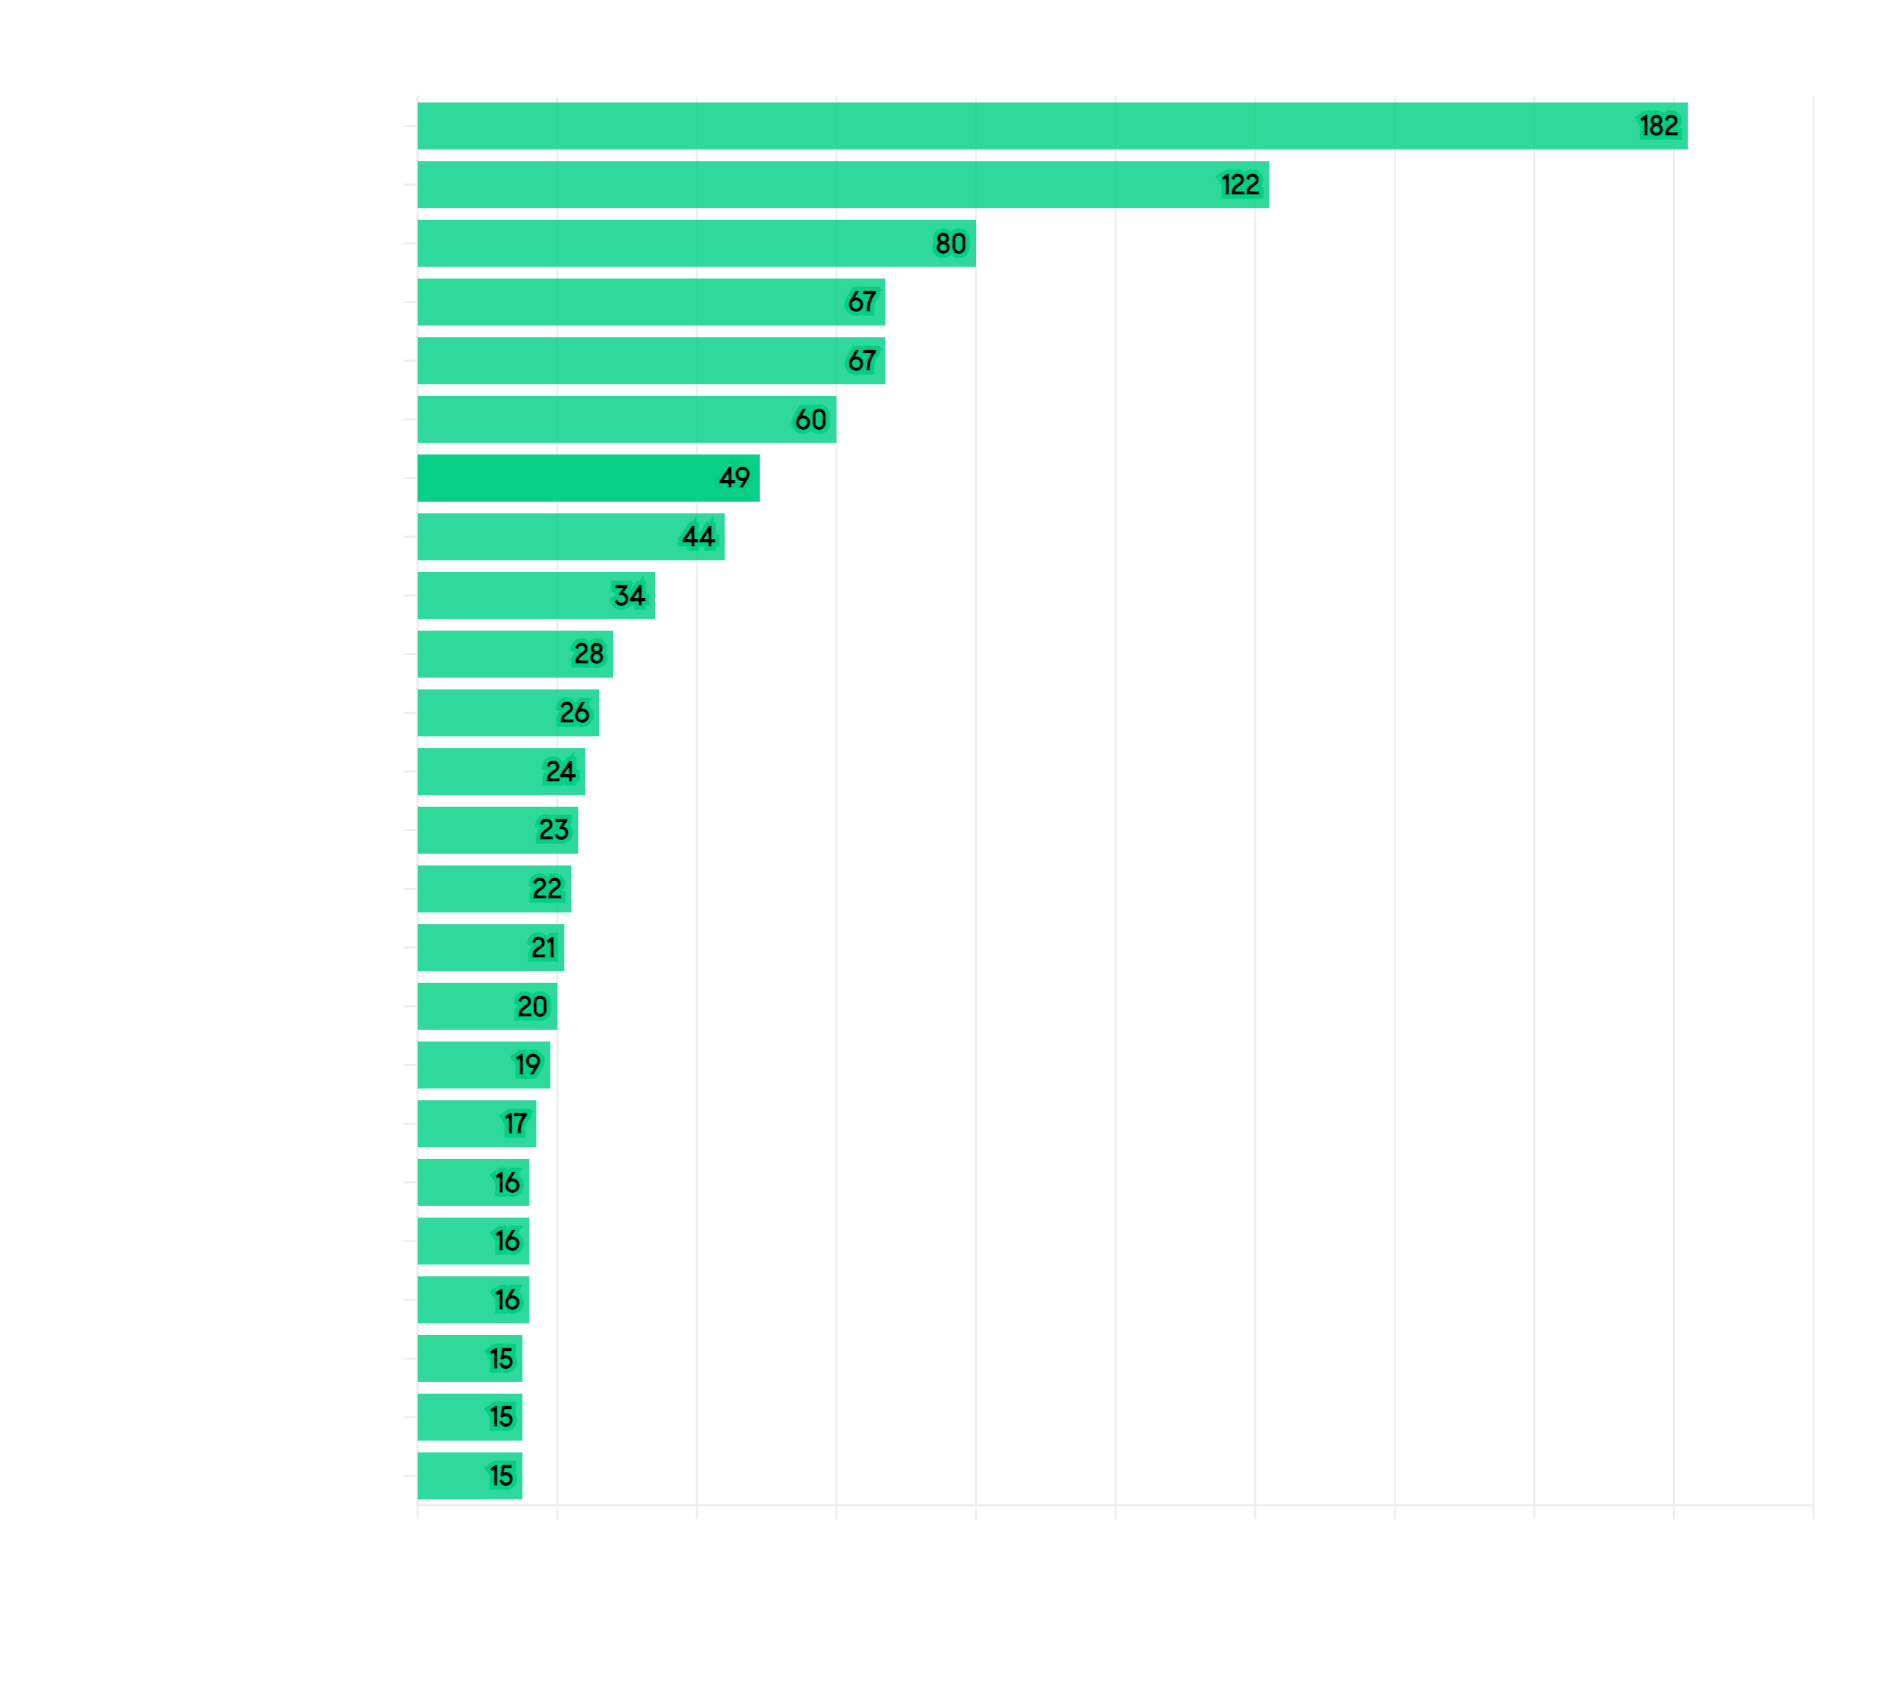
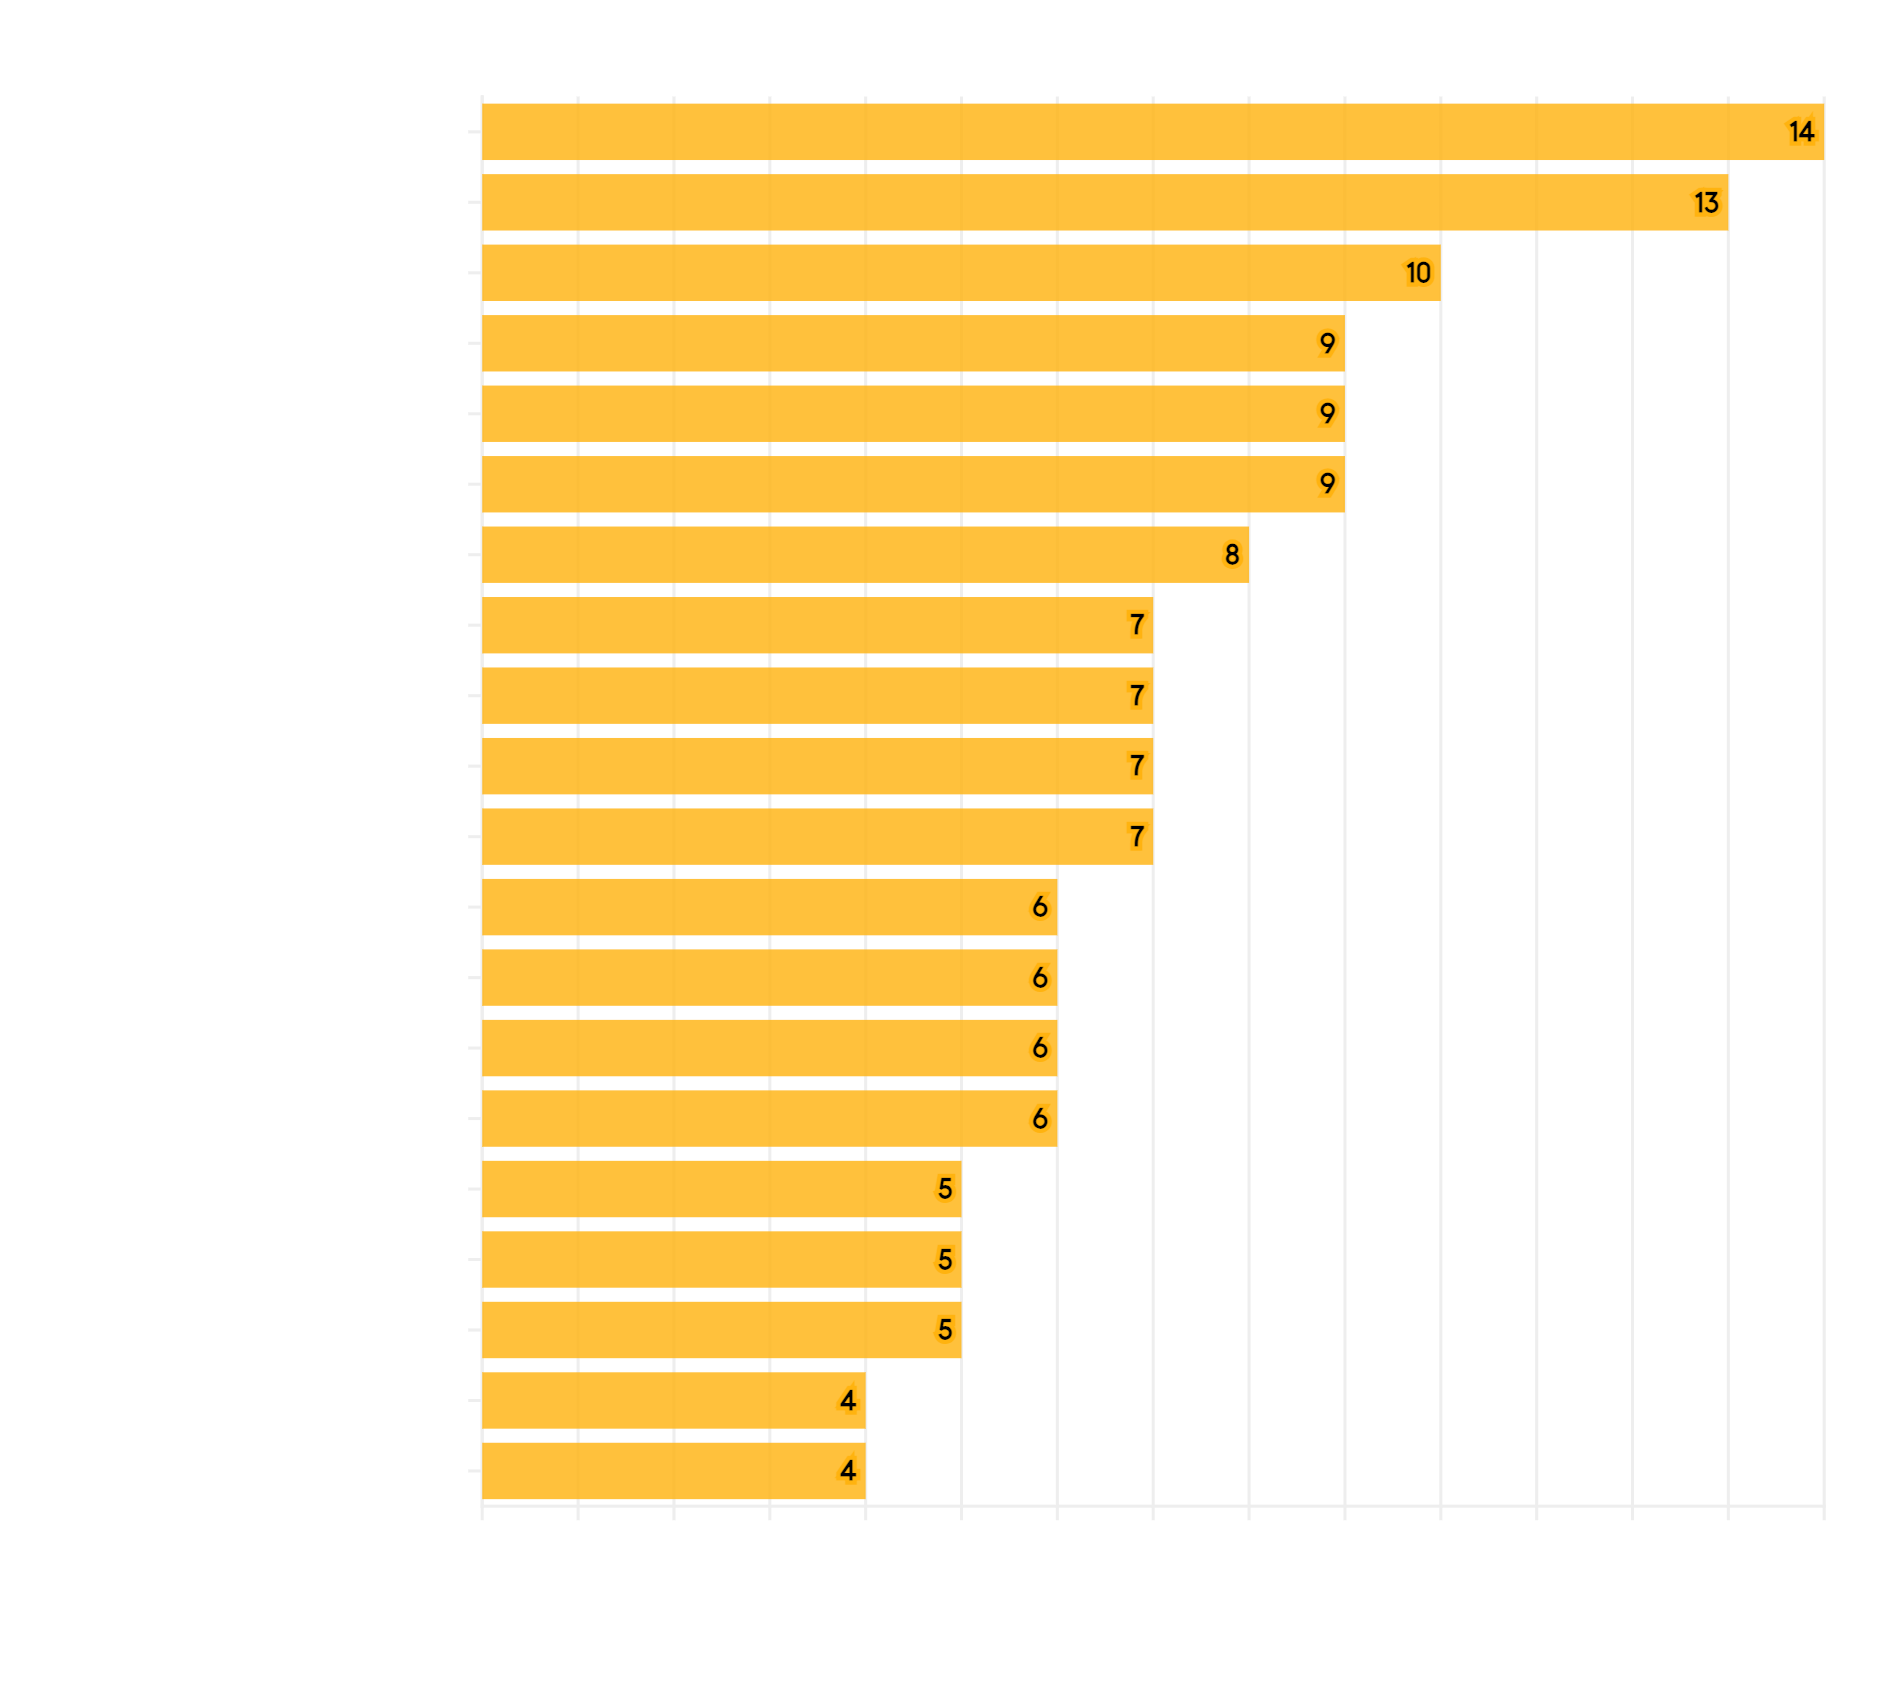
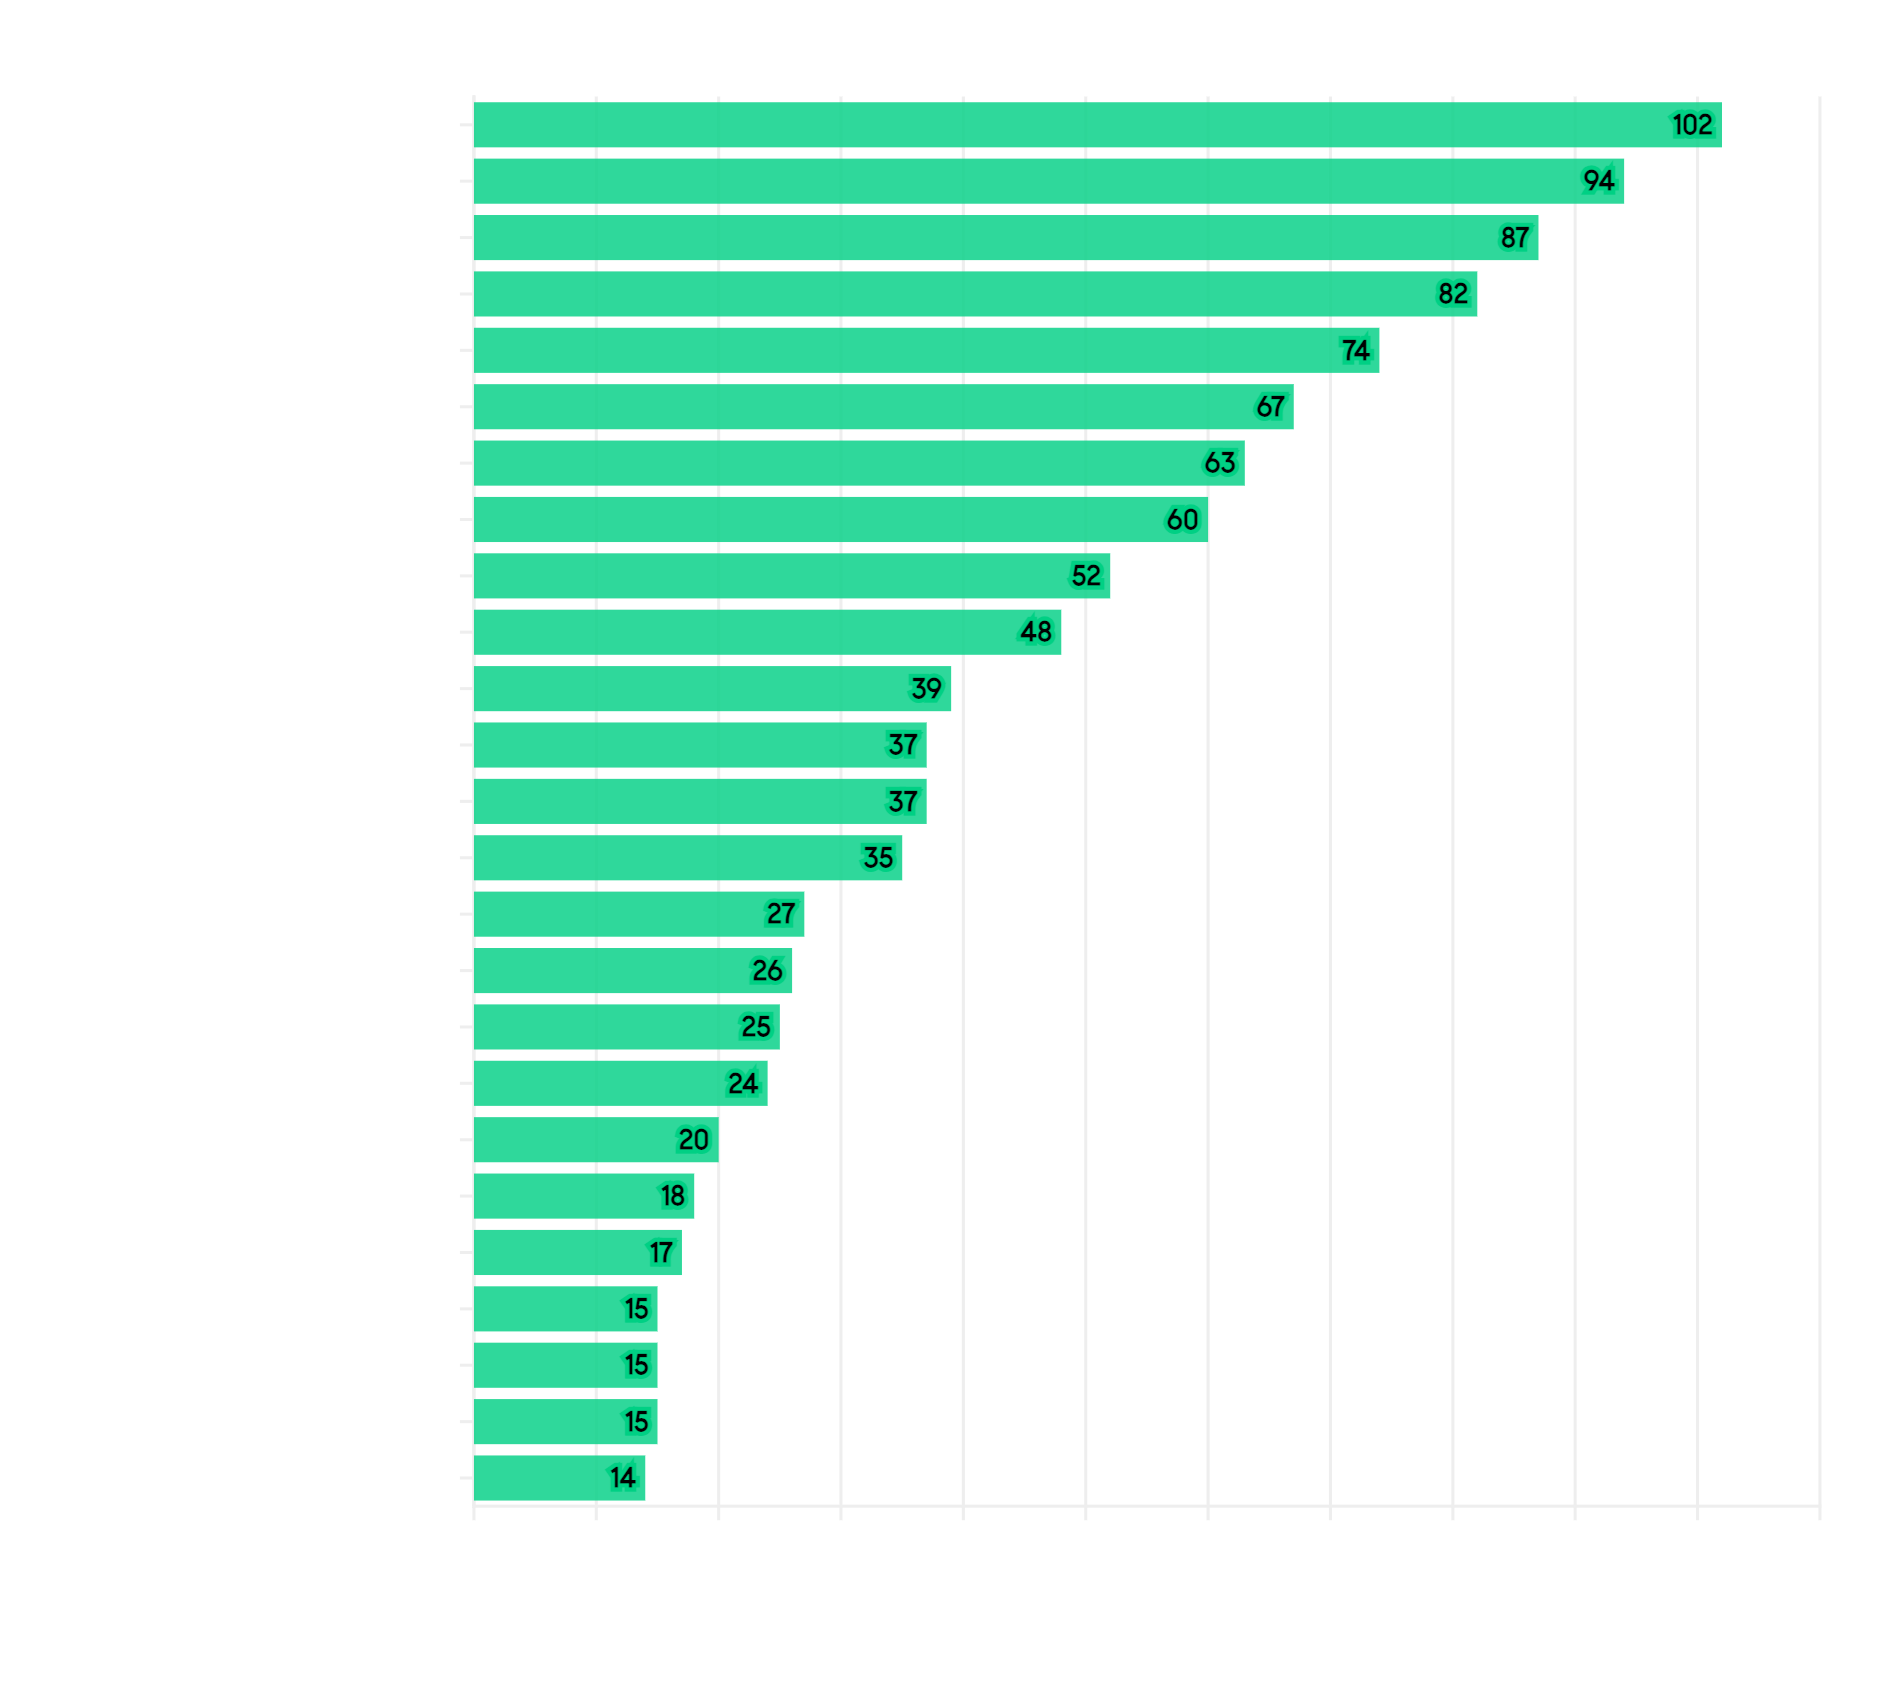
San Francisco’s Largest HOUSE Markets in April
|
|
|
|
|
|
|
|
|
Many factors affect home values: architectural style, quality of construction, square footage, condition, amenities, light, views, privacy, outdoor space, “bonus” rooms, additional parking, quality of location within the neighborhood, and so on.
|
|
|
|
|
|
|
San Francisco Days on Market
|
|
Average Days on Market to Acceptance of Offer in April
|
|
|
|
|
|
|
|
|
Lower days-on-market generally signify stronger buyer demand. It is not unusual for more expensive markets to have higher days-on-market readings, though this is not always the case.
|
|
|
|
|
|
|
|
|
Percentage of Listings Selling Over List Price in April
|
|
|
|
|
|
|
|
|
Higher percentages of sales over list price typically signify greater buyer competition for new listings, but this statistic can be distorted by strategic underpricing strategies by sellers and listing agents.
|
|
|
|
|
|
|
San Francisco Condo Prices
|
|
April Median Condo Sales Prices
Selected Neighborhoods
|
|
|
|
|
|
|
|
|
Many factors affect home values: architectural style, quality of construction, square footage, condition, amenities, light, views, privacy, outdoor space, “bonus” rooms, additional parking, quality of location within the neighborhood, and so on.
|
|
|
|
|
|
|
|
|
April Median CONDO $/Sq.Ft. Values
Selected Neighborhoods
|
|
|
|
|
|
|
|
|
The calculation of dollar per square foot is based on interior living space and doesn’t include common areas, parking spaces, rooms built without permit, storage rooms, decks or patios. All things being equal, a smaller unit will typically sell for a higher dollar per square foot value, but the floor a unit is on – and its views – can play a large role in condo values.
|
|
|
|
|
|
|
|
|
April Median CONDO Square Footage
Selected Neighborhoods
|
|
|
|
|
|
|
|
|
Comparing median sales prices between neighborhoods is not apples to apples, since the median size of units (as well as many other characteristics) vary so widely. The median condo size for the entire city is 2 bedrooms, 2 baths, 1162 sq.ft.
Median unit size does not include storage, parking or outdoor space (deeded or not).
|
|
|
|
|
|
|
|
|
April Median CONDO Square Footage
Selected Neighborhoods
|
|
|
|
|
|
|
|
|
Comparing median sales prices between neighborhoods is not apples to apples, since the median size of units (as well as many other characteristics) vary so widely. The median condo size for the entire city is 2 bedrooms, 2 baths, 1162 sq.ft.
Median unit size does not include storage, parking or outdoor space (deeded or not).
|
|
|
|
|
|
|
San Francisco Top Condo Sales
|
|
April Median Condo Sales Prices
Selected Neighborhoods
|
|
|
|
|
|
|
|
|
The character of condo buildings varies immensely between neighborhoods, from Victorian & Edwardian flats to towering, new high-rise projects – with many other styles built in between.
|
|
|
|
|
|
|
|
|
April Average Days on Market to Acceptance of Offer
|
|
|
|
|
|
|
|
|
Lower days-on-market generally signify stronger buyer demand, but there are various factors at play. Generally speaking, the house market has seen more heated dynamics than the city’s condo market, and thus lower days-on-market readings.
|
|
|
|
|
|
|
San Francisco Condo Sold/List%
|
|
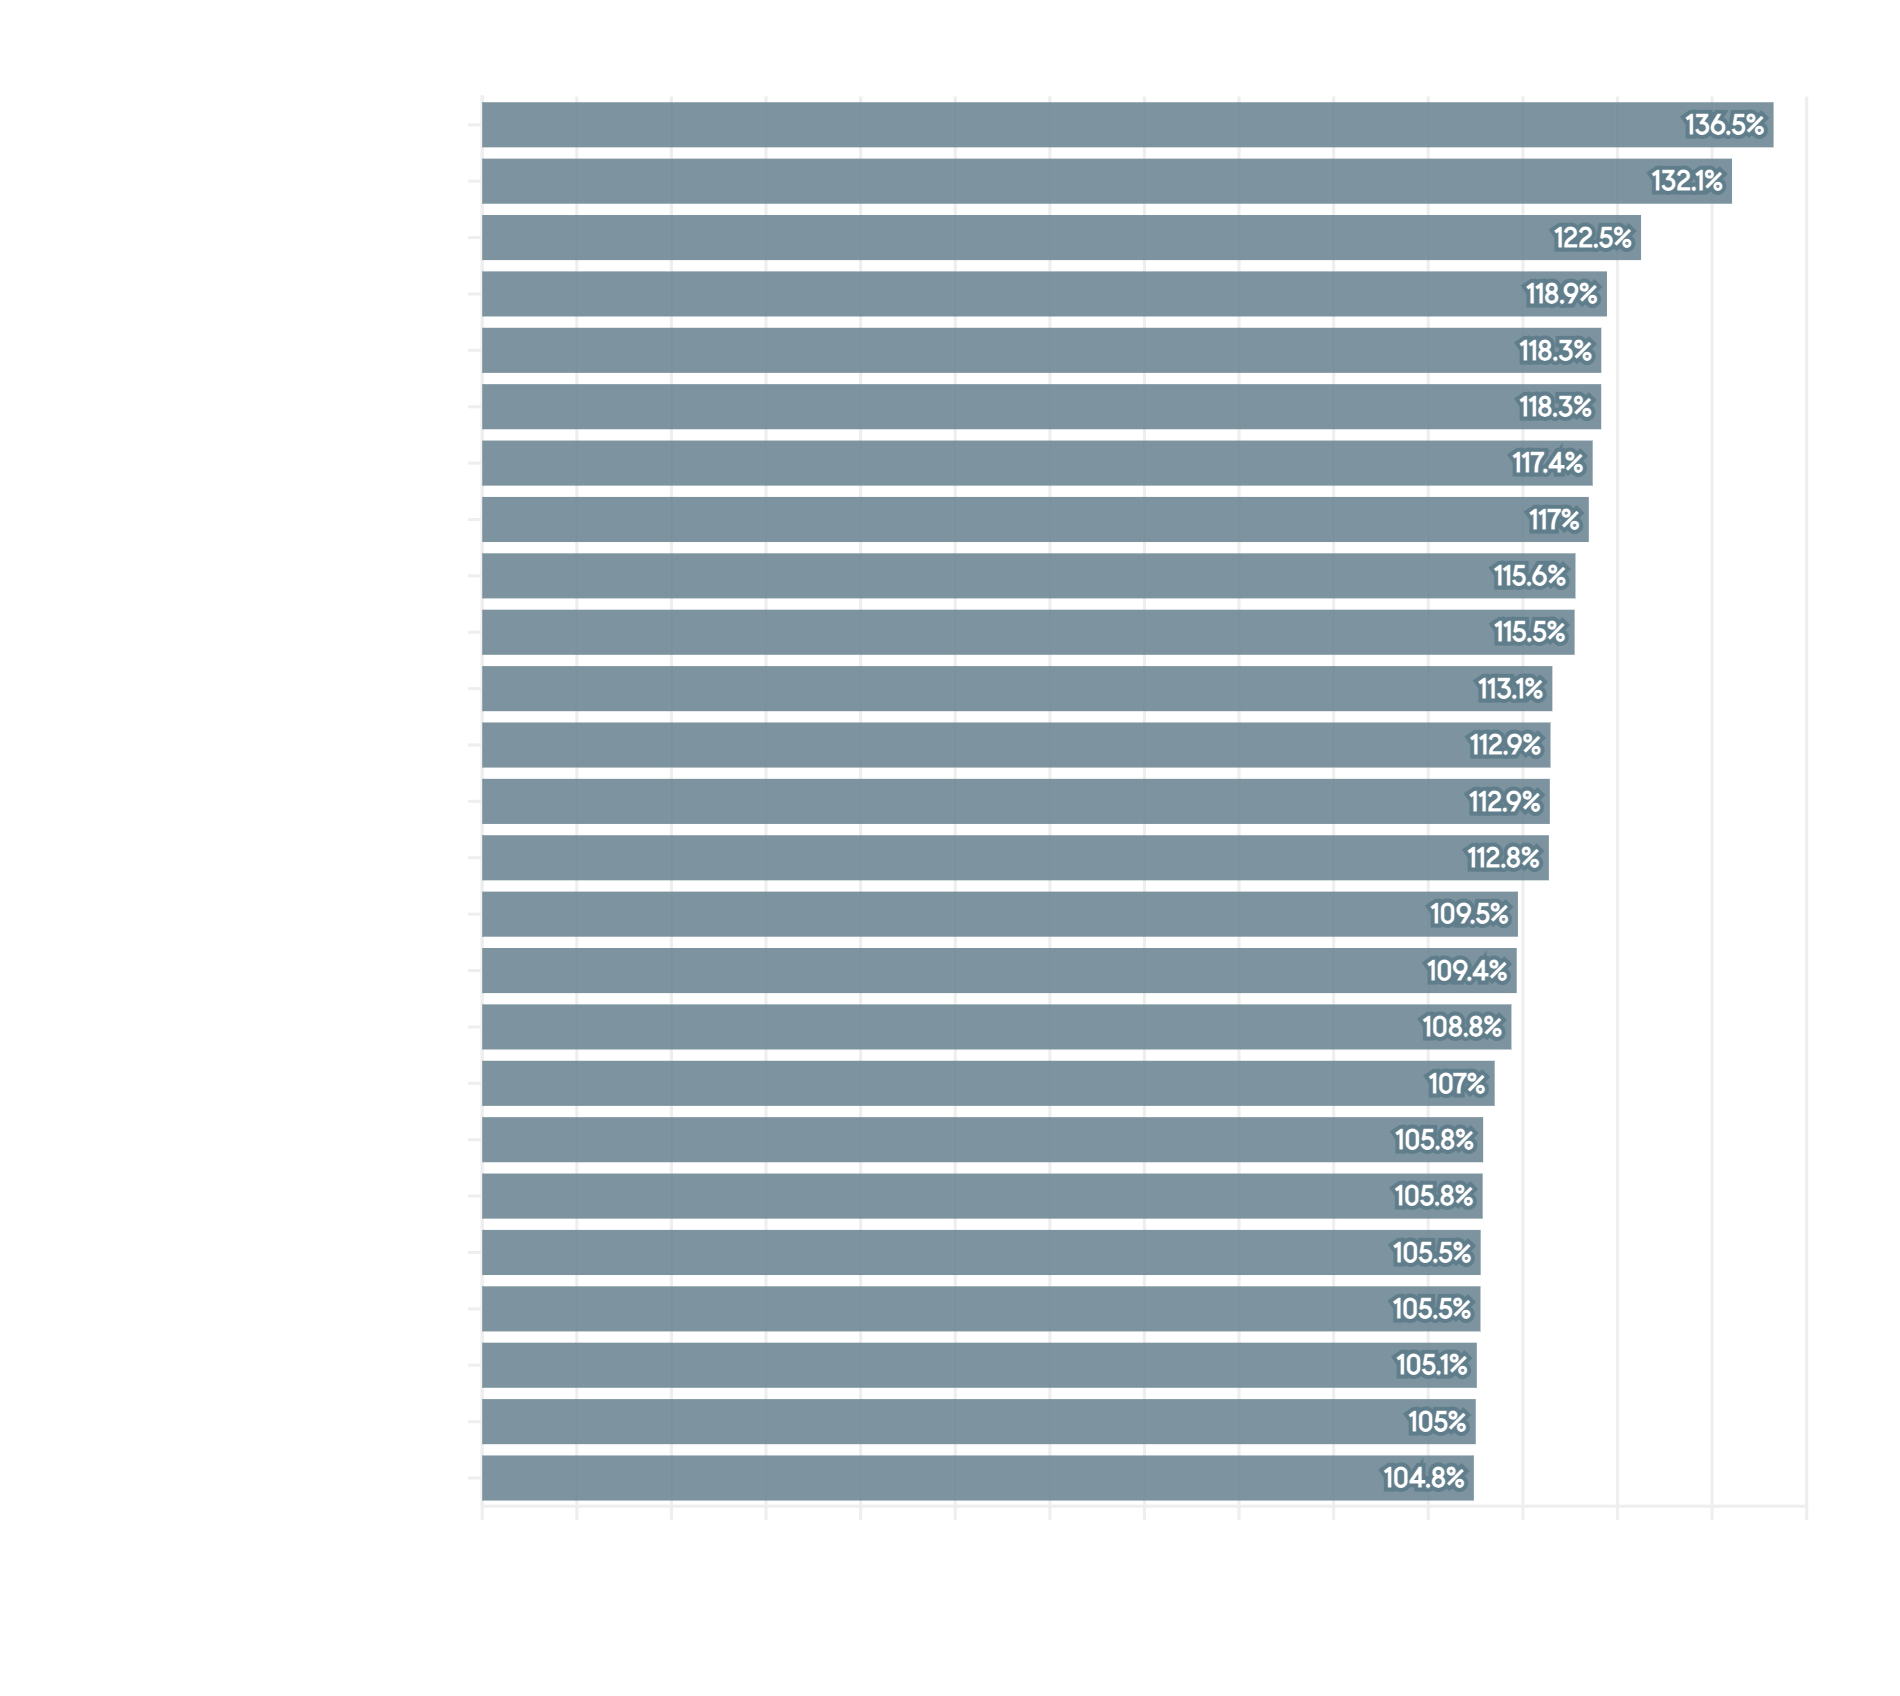
April Percentage of Listings Selling Over List Price
|
|
|
|
|
|
|
|
|
Higher percentages of sales over list price typically signify more heated markets and greater buyer competition for new listings.
|
|
|
|
|
|
|
|
|
|
|
Compass is a real estate broker licensed by the State of California operating under multiple entities. License Numbers 01991628, 01527235, 01527365. All material is intended for informational purposes only and is compiled from sources deemed reliable but is subject to errors, omissions, changes in price, condition, sale, or withdrawal without notice. No statement is made as to the accuracy of any description or measurements (including square footage). This is not intended to solicit property already listed. No financial or legal advice provided. Equal Housing Opportunity. Photos may be virtually staged or digitally enhanced and may not reflect actual property conditions.
|
|
|
|
|
|
|